Content for New Div Tag Goes Here
ASSOCIATION OF CHANGE IN BODY CONDITION SCORE WITH MILK YIELD AND REPRODUCTION TRAITS OF HOLSTEIN COWS
E. Kul1*, A. Şahin1, E. Uğurlutepe1 and M. Soydaner2
1Department of Animal Science, Faculty of Agriculture, University of Kırşehir Ahi Evran, Kırşehir, Turkey
2Plant and Animal Production, Daday Nafi & Ümit Çeri Vocational School of Higher Education, Kastamonu University, Kastamonu, Turkey.
*Corresponding author’s email: ertugrul.kul@ahievran.edu.tr
ABSTRACT
The aim of the study was to determine the effect of changes in body condition score (BSC) on milk yield and reproduction traits in early (30, 60 and 90 d, mid (120 and 150 d) and late lactation (210 and 270 d) in Holstein cows raised on a private dairy cattle farm in Kırşehir, Turkey. The data were obtained from 140 cows calved from November 2014 to November 2015. BSC groups were categorized as low, moderate and high in early lactation (<2.75, 2.75–3.00 and >3.00), mid- lactation (<3.00, 3.00–3.25 and >3.25) and late lactation (<3.25, 3.25–3.50 and >3.50). Cows with low and moderate BCS in early (BCS<2.75 and BCS=2.75-3.00), mid (BCS<3.00 and BCS=3.00–3.25) and late lactation (BCS<3.25 and BCS>3.50) had a higher aily milk yield (DMY), lactation milk yield (LMY) and 305-day milk yield (305-dMY) (P<0.05). Reproduction traits were also affected (P<0.05) by BCS in mid-lactation. In mid-lactation, the cows with low and moderate BCS had a shorter period of calving to the first service interval (CFSI) and lower number of services per conception (NSC) than that of the cows with high BCS (P<0.05). Both milk yield and reproduction traits were adversely affected by high BCS. It is suggested that BCS can be used as a reliable indicator in indirect selection programs for higher milk yield and reproductive performance in Holstein cows.
Key words: Holstein, Body condition score, Milk yield, Fertility.
https://doi.org/10.36899/JAPS.2020.2.0045 Published online March 02, 2020
INTRODUCTION
Milk yield of dairy cows increase during the first two months after calving, followed by a long period of continuous decline (Ingvartsen and Boisclair, 2001). The nutrient requirements for milk synthesis during this period increase dramatically, and the cow is unable to meet energy demands by feed intake. Therefore, dairy cows enter a period of negative energy balance (NEB) (Chandra et al., 2011) and mobilize their lipid reserves, getting thinner, and lose their body condition score (BCS) (Jílek et al., 2008). The cows tending to remain longer in NEB have the worst reproductive performance and get a later start in their reproductive activity (Zink et al., 2012).
Direct measures of energy balance are primarily based on individual cow feed intake and milk yield. However, measurement of individual feed intake is expensive and unfeasible. BCS is a quick, cheap and subjective method (Edmonson et al.,1989; Ural, 2016). Therefore, BCS is widely accepted as the most practical method for assessing changes in body reserves and energy balance during the early period of lactation and substituted in the middle or at the end of lactation in dairy cattle (Bastin and Gengler, 2013; Galiç, 2017) and helps in designing feeding programs (Edmonson et al., 1989; Stádník and Atasever, 2017).
BCS is associated with fertility and milk yield as well as the health of cows during lactation (Roche et al., 2009). A low or excessive body energy reserve may have a greater risk of lower milk yield and fertility for high-yielding cows compared to low productivity cows (Singh et al., 2015). Especially, low BCS may cause health problems such as metabolic disorders (Erdem et al., 2015), reduced milk yield and conception rates (Amer, 2008), prolongation of ovarian activity, low frequency of LH pulses, poor follicular response to gonadotropin stimulation, and a decrease in the functional competence of oocytes (Jílek et al., 2008). In contrast, excessive BCS is associated with ketosis, retained placenta, metritis, displaced abomasum and cystic ovaries (Amer, 2008). Some previous studies on dairy cows determined the effect of BCS on fertility (Roche et al., 2007) and milk yield (Loker et al., 2012); however, others reported that BCS had no effect (Gillund et al., 2001).
Most studies according to BCS have been particularly concerned with calving or early lactation periods. However, a number of studies have revealed that the effects of BCS on milk production and reproduction during different stages of lactation have still been lacking. Bastin and Gengler (2013) stressed that selection for higher BCS in mid-lactation might be a good option to improve the fertility of dairy cows. BCS has been used in dairy cattle management in several countries for a long time. In Turkey, however, it has been used mostly for research purposes in dairy cows. In this context, investigating the association of BCS with productivity parameters will help to eliminate an important cavity on this issue. The objective of this research was to determine the effect of changes in BCS levels on milk yield and reproduction traits not only in early lactation but also in mid and late lactation.
MATERIALS AND METHODS
Data: This study was conducted on a private dairy cattle farm in the Kırşehir province of Turkey. The data included 980 records from 140 Holstein dairy cows calved from November 2014 to November 2015. The cows were grouped as 1st parity (n=60), 2nd parity (n=47) and 3rdparity (n=33).
In the study period, the cows were milked three times a day. Milk yield per cow was automatically recorded on a computer via transporters. Cows were housed in free-stall barns and fed by total mixed ration (TMR). TMR were mainly based on corn silage, alfalfa, barley grain, soybean meal, cottonseed meal, corn flakes, wheat straw, salt, sodium bicarbonate and feed additives.
BCS was measured on a scale of 1 (thin) to 5 (fat) with increments of 0.25, based on the methodology of Edmonson et al. (1989). Thus, each cow for BCS was examined seven times (30, 60, 90, 120, 150, 210 and 270 d of lactation).
The cows were divided into groups according to their mean BCS in early lactation (30, 60 and 90 d), mid-lactation (120 and 150 d) and late lactation (210 and 270 d).
- Groups of cows according to BCS in early lactation; low BCS (BCS<2.75), moderate BCS (BCS = 2.75-3.00) and high BCS (BCS>3.00)
- Groups of cows according to BCS in mid-lactation; low BCS (BCS< 3.00), moderate BCS (BCS = 3.00-3.25) and high BCS (BCS>3.25)
- Groups of cows according to BCS in late lactation; low BCS (BCS<3.25), moderate BCS (BCS = 3.25-3.50) and high BCS (BCS>3.50)
To determine the parity, stage of lactation and calving season on BSC, the fallowing model was used:
γijkl= μ +ai + bj+ck+ εijkl
γijk=dependent factor (BCS)
μ=overall mean
ai=effect of the ith parity (i= 1, 2, 3)
bj=effect of the jth stage of lactation (j= early, mid, late)
cj= effect of the kth calving season (autumn, winter, spring, summer)
εijkl=random error.
To evaluate the effect of BCS on milk yield and reproduction traits, the following model was performed:
γij= μ + ai + εij
γij=dependent factor (milk yield and reproduction traits)
μ: overall mean
ai: effect of BCS groups (i=low, moderate, high)
εij=random error.
While milk yield traits were considered as daily milk yield (DMY), lactation milk yield (LMY), 305-day milk yield (305-dMY) and lactation length (LL), reproduction traits were chosen as number of services per conception (NSC), days open (DO), calving interval (CI) and calving to first service interval (CFSI). The extreme values were removed from the basic dataset in this study.
Statistical Analysis: All statistical analyses were performed using the general linear model (GLM) procedure with SPSS 17.00 package program. The mean values of traits were presented with a standard error of the mean (SEM). Differences among the groups were tested by Duncan’s multiple range tests.
RESULTS AND DISCUSSION
Effect of parity on BCS of Holstein cows is shown in Figure 1. BCS was significantly affected by parity (P<0.05) (Figure 1). This result was in line with the findings of Kadarmideen (2004), who observed that BCS is higher in the first lactation compared with the second and third lactations (P<0.05). Ezanno et al. (2003) also found that BCS decreased with increasing parity in N’Dama cattle. Similarly, some authors (Roche et al., 2007; Hossein‐Zadeh and Akbarian, 2015; Stádník et al., 2017; Stádník and Atasever, 2017) reported that parity is associated with BCS in dairy cows. This process may be affected by cows’ age (Kadarmideen, 2004). It can be explained by still ongoing the growth stage of cows in the first lactation and, therefore, exhibit a flow of energy and nutrients during their growing process (Gallo et al., 1996). Differently, Ural (2016) reported that the effects of parity on BCS were found non-significant.
BCS was also affected by stage of lactation (Figure 2). The changes in BCS during the lactation in this study agree with those obtained by Berry et al. (2011) and Galiç (2017) who found that mean BCS was declined from calving to the mid-lactation stage and increased again thereafter. These findings were confirmed in the studies of Jílek et al. (2008) and Petrovska and Jonkus (2014) who observed that the lowest BCS mean was in the 2nd month and the 80th day of lactation, respectively. Normally, milk yield in dairy cows increases in the early weeks of lactation, but BCS decreases in this period. Actually, the loss of BCS in early period of lactation is associated with peak production (Gallo et al., 1996) and cows enter a state of negative energy balance (NEB) to sustain their milk production (Chandra et al., 2011; Dawod et al., 2015). Loker et al. (2012) emphasized that BCS and milk yield were related physiologically, and as lactation progressed, lower production was associated with greater BCS. Furthermore, the genes related to elevating BCS in mid and late lactation were related to decreased milk yield (Loker et al., 2012).
The effect of the calving season on BCS is shown in Figure 3. Obtained highest BCS mean in the summer and the lowest one from winter (Figure 3) was found as parallel with the findings of Pryce et al. (2001), Ezanno et al. (2003) and Hossein‐Zadeh and Akbarian (2015).
The effect of BCS on milk yield and reproduction traits in early lactation were shown in Table 1. The cows with low (BCS<2.75) and moderate BCS in early lactation had significantly (P<0.05) higher DMY, LMY and 305-dMY when compared with the cows with high BCS. Therefore, our results revealed that milk yield was reversely affected by high BCS in the early lactation period. These results were reinforced by the finding of Samarütel et al. (2006) who detected that cows with low BCS in the first two months of lactation had more DMY. Bayram et al. (2012) and Dawod et al. (2015) reported that the cows with moderate BCS produced higher DMY and 305-dMY in the early lactation period. Besides, there is no special feeding program for fat cows with high milk yield. This case may be seen as the main reason for reduced milk yield in high body condition scored and high milk yielding cows at the early lactation period (Bayram et al., 2012). Moreover, body tissue mobilization and milk production are closely related to each other, and consequently, cows with low body reserves achieved the highest milk yield (Pryce et al., 2002). On the contrary, Petrovska and Jonkus (2014) found that milk productivity was not affected by the BCS.
Reproduction traits like CFSI, DO, CI and NSC values in the early period did not differ significantly among the three BCS groups (Table 1). The present results agree with those of Lopez-Gatius et al. (2003) who found that CFSI, DO and NSC were affected by BCS in early lactation. Contrary to the present finding, Pryce et al. (2002) determined that body tissue mobilization was closely related to reproductive performance. Amer (2008) and Jílek et al. (2008) detected that fatty cows in early lactation had the highest NSC and longest DO.
Loker et al. (2012) emphasized that BCS was the most heritable in mid to late lactation compared to the beginning of lactation. In the mid-lactation period, the cows with low BCS and moderate BCS had higher milk yield than cows with high BCS (P<0.05) (Table 2). These results agreed with those obtained by Jílek et al. (2008) who found that cows with low BCS during the first months of lactation had a great impact on DMY (P<0.01). This could be explained as cows with genetically high milk yield potential being more prone to mobilize their bodies’ fat reserves to milk at the first month of lactation and to have lower BCS (Dawod et al., 2015).
Reproductive performance was more sensitive to changes in BCS (Table 2). In mid-lactation, the cows with lower and moderate BCS had significantly shorter CFSI compared to the cows with higher BCS (P<0.05). The cows with lower BCS had significantly lower NSC than the cows with high BCS (P<0.05). Reproductive performance was more sensitive to changes in BCS (Table 2). Also, DO was shorter in cows with lower BCS than cows with moderate and high BCS, however, the differences were not statistically significant (Table 2).
DMY and 305-dMY in late lactation were the highest in cows with low BCS, but the lowest in cows with high BCS (P<0.05). Also, LMY in late lactation were the highest in cows with low BCS than in cows with high BCS (P<0.05). However, there was no difference between reproduction traits according to the BCS levels (Table 3). According to Maršálek et al. (2008), most fertility problems could be prevented if the cows achieve optimal BCS level before the end of lactation. Gillund et al. (2001) did not determine any relationship between CFSI and higher BCS loss.
In this study, negative correlations were estimated between BCS with DMY, LMY and 305-dMY in all lactation periods (P<0.01) (Table 4). Therefore, the present results revealed that the cows with lower BCS had higher milk yield. The negative correlations between BCS and milk yield in early and late lactation were consistent with those reported by other studies (Pryce et al., 2002; Dechow et al., 2004; Loker et al., 2012). Given these findings, a negative correlation between BCS and milk yield was expected in the study. A very similar result was presented by Pryce et al. (2001) who determined that high-yielding dairy cows generally have a lower BCS. Loker et al. (2012) reported that BCS in early lactation had significantly important correlations with milk production compared with mid to late lactation BCS. The negative correlation between BCS and milk yield in early lactation could be attributed to the higher milk production and associated with the increase in tissue mobilization resulting in lower BCS. Yamazaki et al. (2011) stressed that the modification of the lactation curve to promote an increase in lactation persistency could help maintain the health of dairy cows in late lactation without decreasing total milk yield.
Of all reproduction traits, correlation only between BCS and CFSI in mid-lactation was positive and statically important (r=0.140; P<0.05; Table 4). These results showed that cows with lower BCS in this period had shorter CFSI. The study by Dechow et al. (2002) showed that genetically cows with more BCS in early lactation had a prolonged CFSI. Hossein‐Zadeh and Akbarian (2015) reported that a positive relationship was found between average lactation BCS and DO, CI, NSC. In addition, Dechow et al. (2004) reported very low phenotypic relationships between BCS and reproductive traits.
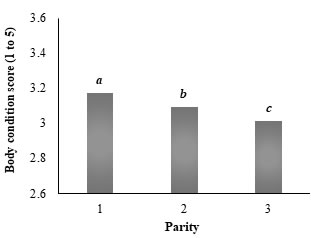
Figure 1. Changes in the body condition score (BCS) among the parities
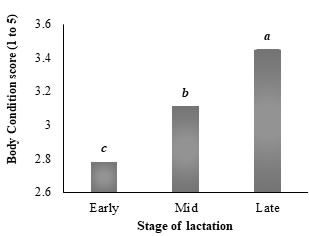
Figure 2. Changes in the body condition score (BCS) among the stages of lactation

Figure 3. Changes in the body condition score (BCS) among the calving seasons
Table 1. Effect of body condition score (BCS) in early stage of lactation on milk yield and reproduction traits.
|
|
Groups of cows according to BCS in early lactation |
|
< 2.75; n=63 |
|
2.75-3.00; n=57 |
|
>3.00; n=20 |
Milk yield traits |
DMY |
32.1±0.64a |
|
30.2±0.53a |
|
27.7±1.36b |
LMY |
10934.5±261.40a |
|
10364.2±219.18a |
|
9292.3±623.28b |
305-dMY |
10067.6±216.43a |
|
9425.3±177.41a |
|
8598.5±462.49b |
LL |
342.0±6.32 |
|
345.1±6.18 |
|
334.7±12.76 |
Reproduction traits |
CFSI |
67.2±1.70 |
|
64.9±1.97 |
|
63.8±2.43 |
DO |
128.0±6.35 |
|
130.4±6.34 |
|
124.3±13.93 |
CI |
407.4±6.37 |
|
407.7±6.43 |
|
400.2±13.44 |
NSC |
2.7±0.16 |
|
2.8±0.17 |
|
2.6±0.34 |
a, b: Different letters on the same line indicate statistically significant differences (P<0.05)
Values are given as means ± standard error
DMY: daily milk yield, LMY: lactation milk yield, 305-dMY: 305-day milk yield, LL: lactation length
CFSI: calving to first service interval, DO: days open, CI: calving interval, NSC: number of services per conception
Table 2. Effects of body condition score (BCS) in the mid-stage of lactation on milk yield and reproduction traits.
|
|
Groups of cows according to BCS in mid-lactation |
|
< 3.00; n=38 |
|
3.00-3.25; n=72 |
|
>3.25; n=30 |
Milk yield traits |
DMY |
32.7±0.73a |
|
31.2±0.52a |
|
27.5±0.94b |
LMY |
10806.6±325.09a |
|
10709.3±227.32a |
|
9613.1±439.40b |
305-dMY |
10192.7±252.22a |
|
9772.3±174.64a |
|
8599.6±326.93b |
LL |
331.2±7.12 |
|
345.0±6.22 |
|
348.3±8.93 |
Reproduction traits |
CFSI |
66.1±1.93b |
|
65.6±1.72b |
|
87.6±21.89a |
DO |
117.7±7.09 |
|
130.6±6.39 |
|
134.8±9.33 |
CI |
396.4±7.29 |
|
408.9±6.34 |
|
411.7±9.37 |
NSC |
2.4±0.17b |
|
2.8±0.16ab |
|
3.1±0.27a |
a, b: Different letters on the same line indicate statistically significant differences (P<0.05)
Values are given as means ± standard error
DMY: daily milk yield, LMY: lactation milk yield, 305-dMY: 305-day milk yield, LL: lactation length
CFSI: calving to first service interval, DO: days open, CI: calving interval, NSC: number of services per conception
Table 3. Effects of body condition score (BCS) in the late stage of lactation on milk yield and reproduction traits.
|
|
Groups of cows according to BCS in late lactation |
|
<3.25; n=25 |
|
3.25-3.50; n=67 |
|
>3.50; n=48 |
Milk yield traits |
DMY |
33.7±1.13a |
|
31.4±0.55b |
|
29.2±0.65c |
LMY |
11525.2±487.92a |
|
10685.1±245.54ab |
|
9830.5±281.17b |
305-dMY |
10619.0±381.81a |
|
9832.9±188.56b |
|
9067.9±206.75c |
LL |
343.7±10.75 |
|
341.4±6.04 |
|
337.6±7.44 |
Reproduction traits |
CFSI |
59.1±4.38 |
|
65.6±1.94 |
|
63.8±2.05 |
DO |
129.3±11.26 |
|
126.9±5.97 |
|
124.1±7.84 |
CI |
407.6±11.31 |
|
404.9±5.98 |
|
402.5±7.86 |
NSC |
2.7±0.26 |
|
2.6±0.15 |
|
2.8±0.22 |
a, b: Different letters on the same line indicate statistically significant differences (P<0.05)
Values are given as means ± standard error
DMY: daily milk yield, LMY: lactation milk yield, 305-dMY: 305-day milk yield, LL: lactation length.
CFSI: calving to first service interval, DO: days open, CI: calving interval, NSC: number of services per conception
Table 4. Correlations between BCS and milk yield and reproduction traits in different stages of lactation.
|
Milk Yield Traits |
|
Reproduction Traits |
|
DMY |
LMY |
305-dMY |
LL |
|
CFSI |
DO |
CI |
NSC |
Early lactation |
-0.326** |
-0.311** |
-0.331** |
-0.077 |
|
-0.127 |
-0.062 |
-0.092 |
-0.034 |
Mid-lactation |
-0.400** |
-0.301** |
-0.114 |
0.020 |
|
0.140* |
0.101 |
0.004 |
0.095 |
Late lactation |
-0.284** |
-0.256** |
-0.300** |
-0.042 |
|
0.069 |
-0.039 |
-0.038 |
0.018 |
*: P<0.05, **: P<0.01
DMY: daily milk yield, LMY: lactation milk yield,305-dMY: 305-day milk yield, LL: lactation length, CFSI: calving to first service interval, DO: days open, CI: calving interval, NSC: number of services per conception
Conclusion: The present study revealed that the effect of parity and stage of lactation on BCS was significantly important (P<0.05). The highest BCS was determined in the first parity compared to the second and third. BCS in early lactation was found the lowest and increased with progressing lactation in this herd. Besides, BCS in cows calving in summer was the highest, but lowest in winter. Milk yield traits were negatively correlated with BCS in three lactation periods. The cows with low and moderate BCS during lactation periods had higher milk yield than cows with high BCS. Therefore, our results revealed that BCS should be applied to increase the milk yield during lactation. Compared with early and late lactation, mid-lactation BCS was positively and significantly correlated with reproductive traits. The lowest CFSI and NSC in mid-lactation were determined in cows with low and moderate BCS. Results from the present study suggest that BCS should be regarded not only in early lactation but also in mid-lactation. In this study, milk yield and reproduction performance were adversely affected by high BCS. To conclude, BCS data may be used as an indicator in indirect selection programs to obtain higher milk yield and reproductive performance in Holstein cows.
Acknowledgments: This work was supported by the Kırşehir Ahi Evran University Scientific Research Projects Coordination Unit with Project Number: PYO-ZRT.4001.14.003. The current experimental protocol was approved by the Animal Care and Use Committee of Kırşehir Ahi Evran University (No=12.02.2014/1/7). We are also grateful to Prof. Dr. Ahmet Şahin for his invaluable help in proofreading the manuscript.
Declaration of conflict of interest: The authors declare no conflict of interest relating to this manuscript.
REFERENCES
- Amer, H.A. (2008). Effect of body condition score and lactation number on selected reproductive parameters in lactating dairy cows. Glob. Vet. 2(3): 130–137.
- Bastin, C., and N. Gengler (2013). Genetics of body condition score as an indicator of dairy cattle fertility. A review. Biotechnol. Agron. Soc. Environ. 17(1): 64–75.
- Bayram, B., V. Aksakal, and Ö. Akbuluk (2012). Effect of the body condition score on some reproduction and milk yield traits of Swedish red and white cows. J. Anim. Plant Sci. 22(3): 545–551.
- Berry, D.P., F. Buckley, and P. Dillon (2011). Relationship between live weight and body condition score in Irish Holstein-Friesian dairy cows. Irish J. Agric. Food Res. 50: 141–147.
- Chandra, G., A. Aggarwal, A.K. Singh, M. Kumar, R. Kushwaha, A. Singh, and Y.K. Singh (2011). Negative energy balance and reproduction: A review. Agri. Reviews 32(4): 246–254.
- Dawod, A., T.M. Abdel-Hamid, and S. Ramadan (2015). Influences of prefresh and early fresh body condition score changes on some Holstein dairy performance traits. Res. Rev. J. Dairy Sci. Technol. 4(2): 12–18.
- Dechow, C.D., G.W. Rogers, L. Klei, T.J. Lawlor, and P.M. Van Raden (2004). Body condition scores and dairy form evaluations as indicators of days open in US Holsteins. J. Dairy Sci. 87: 3534–3541.
- Dechow, C.D., G.W. Rogers, and J.S. Clay (2002). Heritability and correlations among body condition score loss, body condition score, production and reproductive performance. J. Dairy Sci. 85: 3062–3070.
- Edmonson, A.J., I.J. Lean, L.D. Weaver, T. Farver, and G. Webster (1989). A body condition scoring chart for Holstein dairy cows. J. Dairy Sci. 72: 68–78.
- Erdem, H., S. Atasever, and E. Kul (2015). Relations of body condition score with milk yield and reproduction traits in Simmental cows. Large Anim. Rev. 21: 231–234.
- Ezanno, P., A. Ickowicz, and F. Bocquier (2003). Factors affecting the body condition score of N’Dama cows under extensive range management in southern Senegal. Anim. Res. 52: 37–48.
- Galiç, A. (2017). Determination of the Body Condition Score and Its Relationship with Milk Yield in Turkish Holstein Cows. Journal of Agricultural Sciences 23: 464–471.
- Gallo, L., P. Carnier, M. Cassandro, R. Mantovani, L. Bailoni, B. Contiero, and G. Bittante (1996). Change in body condition score of Holstein cows as affected by parity and mature equivalent milk yield. J. Dairy Sci. 79: 1009–1015.
- Gillund, P., O. Reksen, Y.T. Gröhn, and K. Karlberg (2001). Body condition related to ketosis and reproductive performance in Norwegian dairy cows. J. Dairy Sci. 84: 1390–1396.
- Hossein‐Zadeh, N.G., and M. Akbarian (2015). Factors affecting body condition score and its relationship with productive and reproductive performances of Holstein cows. Iran J. Appl. Anim. Sci. 5(1): 73–79.
- Ingvartsen, K.L., and Y.R. Boisclair (2001). Leptin and the regulation of food intake, energy homeostasis and immunity with special focus on periparturient ruminants. Domest. Anim. Endocrinol. 21: 215–50.
- Jílek, F., P. Pytloun, M. Kubešová, M. Štípková, J. Bouška, J. Volek, J. Frelich, and R. Rajmon (2008). Relationships among body condition score, milk yield and reproduction in Czech Fleckvieh cows. Czech J. Anim. Sci. 53(9): 357–367.
- Kadarmideen, H.N. (2004). Genetic correlations among body condition score, somatic cell score, milk production, fertility and conformation traits in dairy cows. Animal Science 79: 191–201.
- Loker, S., C. Bastin, F. Miglior, A. Sewalem, L.R. Schaeffer, J. Jamrozik, A. Ali, and V. Osborne (2012). Genetic and environmental relationships between body condition score and milk production traits in Canadian Holsteins. J. Dairy Sci. 95: 410–419.
- Lopez-Gatius, F., J. Yaniz, and D. Madriles-Helm (2003). Effects of body condition score and score change on the reproductive performance of dairy cows: A meta-analysis. Theriogenology 59: 801–812.
- Maršálek, M., J. Zedníková, V. Pešta, and M. Kubešová (2008). Holstein cattle reproduction in relation on milk yield and body condition score. J. Cent. Eur. Agric. 9(4): 621–628.
- Petrovska, S., and D. Jonkus (2014). Relationship between body condition score, milk productivity and live weight of dairy cows. Research for Rural Development (1): 100–106.
- Pryce, J.E., M.P. Coffey, S.H. Brotherstone, and J.A. Woolliams (2002). Genetic relationship between calving interval and body condition score conditional on milk yield. J. Dairy Sci. 85: 1590–1595.
- Pryce, J.E., M.P. Coffey, and G. Simm (2001). The relationship between body condition score and reproductive performance. J. Dairy Sci. 84: 1508–1515.
- Roche, J.R., N.C. Friggens, J.K. Kay, M.W. Fisher, K.J. Stafford, and D.P. Berry (2009). Invited review: Body condition score and its association with dairy cow productivity, health, and welfare. J. Dairy Sci. 92: 5769–5801.
- Roche, J.R., K.M. Macdonald, C.R. Burke, and D.P. Berry (2007). Associations between body condition score, body weight and reproductive performance in seasonal-calving pasture-based dairy cattle. J. Dairy Sci. 90: 376–391.
- Samarütel, J., K. Ling, H. Jaakson, T. Kaart, and O. Kart (2006). Effect of body condition score at parturation on the production performance, fertility and culling in primiparous Estonian Holstein cows. Veterinarija Ir Zootechnika 36(58): 69–74.
- Singh, V., V.K. Singh, S.P. Singh, and B. Sahoo (2015). The effect of body condition score at calving on milk yield, milk composition and udder health status of dairy animals. J. Dairy. Vet. Anim. Res. 2(2): 00029.
- Stádník, L., S. Atasever, and J. Ducháček (2017). Effects of body condition score and daily milk yield on reproduction traits of Czech Fleckvieh cows. Anim. Reprod. 14(1): 1264-1269.
- Stádník, L., and S. Atasever (2017). Influence of somatic cell count and body condition score on reproduction traits and milk composition of Czech Holstein cows. Indian J. Anim. Res. 51(4): 771-776.
- Ural, D.A. (2016). The use of new practices for assessment of body condition score. Rev. MVZ Córdoba 21(1): 5154–5162.
- Yamazaki, T., H. Takeda, and A. Nishiura (2011). Phenotypic relationship between lactation persistency and change in body condition score in first-lactation Holstein cows. Asian-Aust. J. Anim. Sci. 24(5): 610–615.
- Zink, V., J. Lassen, and M. Štipkova (2012). Genetic parameters for female fertility and milk production traits in first-parity Czech Holstein cows. Czech J. Anim. Sci. (3): 108–114.
|