|
Volume 30, No. (4), 2020 (August)
(Impact Factor 0.529; JCR 2018) |
|
USE OF MULTIVARIATE ADAPTIVE REGRESSION
SPLINES (MARS) FOR PREDICTING PARAMETERS OF BREAST MEAT IN QUAILS
T. Şengül*1, Ş. Çelik1 and Ö.
Şengül2
1Bingöl University,
Faculty of Agriculture, Department of Anim. Sci. Bingöl, 12000, Turkey
2Uludağ University, Faculty of
Agriculture, Department of Anim. Sci. Bursa, 16000, Turkey
*Corresponding Author E-mail:
tsengul2001@yahoo.com
ABSTRACT
The
aim of this study was to determine the effects of variety and sex on the color of
the breast meat (brightness: L*, red color: a*, yellow color:
b*) in quails. In this study, a total of 144 quails from three different
varieties (Wild-type, Dark Brown and Golden) were employed. The color and pH parameters
of the breast meat were measured in quails slaughtered in week 10. In order to predict
the brightness (L*), red color (a*), and yellow color (b*)
values of the breast meat, Multivariate Adaptive Regression Splines (MARS) models
were implemented. When determining the best model, attention was paid to minimize
the Generalized Cross Validation (GCV), Root Mean Square Error (RMSE), and Mean
Absolute Deviation (MAD) statistics and to maximize coefficient of determination
(R2) and adjusted R2 values. In the MARS models constructed
to predict L*, a* and b*, it was found that R2 values were 0.999, 0.999, and 0.999; adjusted R2 values were 0.997, 0.992,
and 0.996; and RMSE values were 0.068, 0.082, and 0.038, respectively. As a
result, it could be suggested that MARS modeling may be a useful tool for the
prediction of the color parameters of the breast meat.
Keywords: Quail,
breast meat, meat color, MARS model.
https://doi.org/10.36899/JAPS.2020.4.0092
Published
online April 25, 2020
INTRODUCTION
Meat
color in poultry is affected by age, sex, genotype, feed, intramuscular fat distribution,
water content of meat, pre-slaughter conditions, and processing techniques
(Froning, 1995). Meat color is dependent largely on myoglobin concentration and
partially on the presence of pigments such as hemoglobin in the medium. The discoloration of meat can be attributed to
the amount of such pigments contained in the meat. The chemical structure of pigments,
and ultimately, the rate of reflection of light that falls on meat change (Northcutt,
2007). The color of poultry meat varies from bluish
white to yellow, depending on race, exercise, age and diet.
It
was reported that characteristics associated with the color of meat in quails are
usually hereditary to a moderate to high extent, and it may be the case that there
is an effect of genes linked to sex (Mir et. al., 2017).An argument has emerged
that genetics has a predominant role in the control of meat quality characteristics
such as color and pH. Selection studies carried out to improve live weight have
influenced the quality of meat. As live weight increases, water and protein levels
in the carcass decrease, and the carcass fat, number of muscle fibers, muscle fiber
lengths (Skiba et al., 2012). Heritability values of certain meat quality
characteristics in Japanese quails were estimated for brightness (L*)=0.23,
red color (a*)=0.45, and yellow color (b*)=0.22 (Oguz et
al., 2004). In chickens, sex was reported to be an influential factor on many
parameters of meat quality (Mehaffey et al., 2006; Jaturasitha et al.,
2008).
The
color of quail meat is darker than that of chicken meat, and lighter than that of
goose meat. Quails’ breast and thigh muscles have almost no fatty tissue
(Riegel et al., 2003). Muscle fibers are separated by a thin connective tissue
giving the characteristic taste of the meat (Hejnowska et al., 1999). López et al. (2011) reported that there was a significant relationship between
sex and the pH (P<0.05) of the breast meat in the 24 hours after chickens are
slaughtered. They have indicated that female chickens have a lower pH than male
chickens. Tougan et al. (2013) reported that the taste of meat diminishes
as the slaughter age decreases in poultry, but juiciness and tenderness increase. Bilal and Bostan (1996)
informed that in quails, age affects the composition of carcass, and sex affects
carcass yield.
Narinc et al. (2013) reported that the final pH, L*, a* and
b* color values of breast meat quality characteristics of 5-week-old
broilers were found 5.94, 43.09, 19.24 and 7.74, respectively. The authors have
reported that there was a high and negative correlation between pH and body weight,
and a lower and positive correlation between the L* value and these characteristics
(P<0.05). Remignon et al. (1998) reported that long-term stress increases
the pH of breast meat in quails, but does not affect the L*, a* and b* color values. Genchev et al. (2008) have determined
that the L*, a* and b* values of the breast meat
30 minutes, 24 hours and 7 days after the slaughter of 5-week-old quails were 43.22,
8.02, 11.04; 40.81, 10.16, 9.55; and 45.67, 11.68, 14.48, respectively. In the
earlier study reported that color parameters (L*, a* and b*)
in the meat of young and old quails were determined to be 58.93, 12.86, 20.86 and
61.54, 6.84, 19.81, respectively (Boni et al., 2010). Nasirifar et al.
(2016) found that the L*, a* and b* color values
were 37.8, 37.9; 11.9, 13.1; and 12.8, 14.5, respectively for male and female
quails aged 2 weeks.
With
the scope of buying preference of consumers, the meat color characteristics
were determinative factors. To make an accurate decision in determining factors
affecting the characteristics, use of sophistical statistical methods is
recommendable. In this concept, more emphasis on powerful statistical
approaches i.e. Artificial Neural Networks (ANNs) and MARS is still required in
literature. There were a few of animal science studies on MARS modeling. (Aytekin et al., 2018; Celik and Yilmaz, 2018; Celik et al., 2018; Erturk,
2018; Erturk et al., 2018; Aksoy et al., 2018a; Aksoy et al.,
2018b, Sahin et al., 2018; Aksoy et al., 2019; Celik, 2019). However,
to our best knowledge, the published information on predicting color parameters
of the quail breast meat through MARS data mining algorithm has not yet been
documented. To fill this gap in poultry literature, an attempt was
made in the present investigation to find factors affecting brightness (L*),
red color (a*) and yellow color (b*) characteristics in
the breast meat of 10-week-old male and female quails through MARS modeling.
MATERIALS AND METHODS
Material: The
animal materials of the research consisted of a total of 144 Japanese quails from
3 different varieties, which were raised in the research coop of the Department
of Animal Sciences at Bingol University, Faculty of Agriculture, Bingol
province located in Eastern Anatolia Region of Turkey. The Wild-type, Dark Brown
and Golden quails were used as the quail varieties. The quails were placed into
space compartments as 3 replicates where there were 48 male and female quails from
each variety in each compartment. Throughout the entire trial period, the animals
were housed in the same compartments. The study was carried out for 10 weeks. The
trial was designed as to have 6 groups and 8 quails in each replication. The quails
were fed with feed containing 23% raw protein and 3100 kcal/kg ME in the first week,
and with feed containing 20% raw protein and 3250 kcal/kg ME in the consequent weeks.
At the end of the fattening period (week 10), 4 animals were slaughtered from each
group, and brightness (L*), red color (a*), yellow color (b*)
and pH were measured in their breast meat (skinless). A Lovibond (RT SERIES for MODEL SP60) was used to determine
the color of the meat, and a Testo 205 device was used to measure the pH level.
Method: Three
different MARS models were implemented separately for different dependent variables
(L, a* and b*) to identify whether meat color in quails was
affected by variety (Wild-type, Dark Brown and Golden) and sex (male and female).
These models were as follows:
Model 1: The dependent
variable was L*, and the independent variables were a*, b*,
pH, sex, and variety.
Model 2: The dependent
variable was a*, and the independent variables were L*, b*,
pH, sex, and variety.
Model 3: The dependent
variable was b*, and the independent variables were L*, a*,
pH, sex, and variety.
In these models, variety
and sex were factors, whereas L*, a*, b*, and pH
were treated as continuous variables.
The
MARS model is one of the methods used to reveal the effects of independent variables
on a dependent variable when analyzing data. This method is a multivariate non-parametric
regression technique developed by Friedman (1991) that uses complex algorithms that
can evaluate many variables together.
The MARS algorithm
can be rewritten as follows (Eyduran et al, 2019):
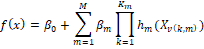
Where
f(x) is the
predicted value of the dependent variable,  is an intercept, is an intercept,  is the basis
function, where is the basis
function, where  is an index of
the predictor for the mth component of the kth product, is an index of
the predictor for the mth component of the kth product,  is the parameter
controlling the order of interaction. is the parameter
controlling the order of interaction.
After
building the most suitable MARS model, the basis functions that did not
contribute much to the model fitting performance were eliminated in the pruning
process based on the following generalized cross-validation error (GCV)
(Koronacki and Ćwik 2005):
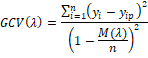
Where:
n is the number of
training cases,  is the observed
value of a response variable, is the observed
value of a response variable,  is the predicted
value of a response variable, is the predicted
value of a response variable,  is a penalty
function for the complexity of the model with λ terms. is a penalty
function for the complexity of the model with λ terms.
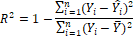
To
measure the predictive performance of MARS, the following goodness of fit
criteria were calculated (Willmott and
Matsuura, 2005; Takma et al., 2012; Ali et al., 2015);
1. Coefficient of
Determination
2. Adjusted
Coefficient of Determination

3.
Root-mean-square error (RMSE) presented by the following formula;
4. Standard
deviation ratio (SDratio);

SD
ratio estimates should be less than 0.40 for a good fit explained by some
authors (Grzesiak et al., 2003; Grzesiak and Zaborski, 2012).
5.
Mean absolute deviation (MAD):

where: n is the number of cases in a set, k is the number of model
parameters, Yi is the actual (observed) value of an output
variable, Yip is the predicted value of an output variable, sm is the standard deviation of model errors, sd is the standard
deviation of an output variable.
Statistical
evaluations on MARS algorithm was specified using STATISTICA program (12.5
version). See the book of Eyduran et al. (2019) to obtain more detailed
information about MARS algorithm.
RESULTS
L* (brightness) value: A
MARS model was constructed by selecting variety, sex, a*, b* and pH as independent variables to predict the L* value of the breast
meat. Model fit statistics for the L* are presented in Table 1.
Table
1. Model 1 goodness of fit criteria and GCV values according to order of
interactions.
Order of int. |
Maximum number
of BF |
Number of BF |
Number of terms |
GCV |
R2 |
Adj. R2 |
SDratio |
RMSE |
MAD |
1 |
80 |
16 |
11 |
1.778 |
0.961 |
0.925 |
0.445 |
0.738 |
0.485 |
1 |
90 |
16 |
11 |
1.778 |
0.961 |
0.925 |
0.445 |
0.738 |
0.485 |
1 |
100 |
16 |
11 |
1.778 |
0.961 |
0.925 |
0.445 |
0.738 |
0.485 |
2 |
80 |
38 |
20 |
0.160 |
0.999 |
0.997 |
0.135 |
0.068 |
0.044 |
2 |
90 |
38 |
20 |
0.160 |
0.999 |
0.997 |
0.135 |
0.068 |
0.044 |
2 |
100 |
38 |
20 |
0.160 |
0.999 |
0.997 |
0.135 |
0.068 |
0.044 |
BF: Basis
functions, int: interactions
According
to the goodness of fit results shown in Table 1, the best model was found to be
the MARS model with 20 terms and the second degree interactions. For this model,
the parameters were predicted as follows: GCV=0.160, R2=0.999, Adj. R2=0.997,
SDratio=0.135, RMSE=0.068 and MAD=0.044. Basis functions and coefficients
are given in Table 2 according to the aforementioned model.
Table 2. Results of
the Model 1 MARS algorithm (for L*).
|
Basic function |
Coefficient |
|
Constant
(intercept) |
38.772 |
BF1 |
max(0;
Female) |
18.479 |
BF2 |
max(0;
b-8,79)*max(0; Female) |
3.368 |
BF3 |
max(0;
a-19.02)*max(0; Female) |
30.774 |
BF4 |
max(0;
19.02-a)*max(0; Female) |
-7.266 |
BF5 |
max(0;
Wild-type) |
-5.468 |
BF6 |
max(0;
Wild-type)*max(0; Female) |
48.052 |
BF7 |
max(0;
a-15.89)*max(0; b-8.79)*max(0; Female) |
-2.810 |
BF8 |
max(0;
a-15.89) |
-3.764 |
BF9 |
max(0;
a-15.89)*max(0; Dark-Brown) |
-1.336 |
BF10 |
max(0;
a-15.89)*max(0; b-8.79) |
0.251 |
BF11 |
max(0;
a-15.89)*max(0; Wild-type) |
-4.478 |
BF12 |
max(0;
a-15.89)*max(0; Wild-type)*max(0; Female) |
-15.370 |
BF13 |
max(0;
b-8.79) |
2.291 |
BF14 |
max(0;
Dark-Brown) |
3.024 |
BF15 |
max(0;
a-15.89)*max(0; b-8.79)*max(0; Wild-type) |
1.680 |
BF16 |
max(0;
19.02-a)*max(0; b-12.46)*max(0; Female) |
206.121 |
BF17 |
max(0;
pH-6.38)*max(0; Female) |
-10.658 |
BF18 |
max(0;
6.38-pH)*max(0; Female) |
-19.545 |
BF19 |
max(0; b-8.79)*max(0;
Golden)*max(0; Female) |
-0.633 |
Explanations for other
basis functions and coefficients can be said to be similar to the results given
in Table 2. The MARS equation of Model 1 that was obtained according to these results
was as follows.
L=38.772+18.479*max(0;
Female)+3.368*max(0; b-8.79)*max(0; Female)+30.774*max
(0; a-19.02)*max(0; Female)-7.266*max(0;19.02-a)*max(0;
Female)-5.468*max(0; Wild-type)+48.052*max(0; Wild-type)*max(0;
Female)-2.81*max(0; a-15.89)*max(0; b-8.79)*max(0;
Female)-3.764*max(0; a-15.89)-1.336*max(0; a-15.89)*max(0;
Dark-Brown)+ 0.251*max(0; a-15.89)*max(0; b-8.79)-4.478*max(0;
a-15.89)*max(0; Wild-type)-15.370*max(0; a-15.89)*max(0;
Wild-type)*max(0; Female)+2.291*max(0; b-8.79)+3.024*max
(0; Dark-Brown)+1.680*max(0; a-15.89)*max(0; b-8.79)*max(0;
Wild-type)+206.121*max(0; 19.02-a)*max(0; b-12.46)*max(0;
Female)- 10.658*max(0; pH-6.38)*max(0; Female)-19.545*max(0;
6.38-pH)*max(0; Female)-0.633*max(0; b-8.79)*max(0;
Golden)*max (0; Female).
Table 3. Predicted
L* values based on the values of independent variables.
a* |
b* |
pH |
Variety |
Sex |
L* |
20 |
12 |
6.50 |
Wild-type |
Male |
32.262 |
20 |
12 |
6.50 |
Wild-type |
Female |
38.235 |
20 |
12 |
6.50 |
Dark-Brown |
Male |
31.498 |
20 |
12 |
6.50 |
Dark-Brown |
Female |
52.589 |
20 |
12 |
6.50 |
Golden |
Male |
33.965 |
20 |
12 |
6.50 |
Golden |
Female |
53.023 |
24 |
15 |
6.35 |
Wild-type |
Male |
77.945 |
24 |
15 |
6.35 |
Wild-type |
Female |
51.868 |
24 |
15 |
6.35 |
Dark-Brown |
Male |
27.293 |
24 |
15 |
6.35 |
Dark-Brown |
Female |
77.815 |
24 |
15 |
6.35 |
Golden |
Male |
35.104 |
24 |
15 |
6.35 |
Golden |
Female |
81.692 |
a* (red
color) value: A
MARS algorithm was built by selecting variety, sex, L*, b* and pH as independent variables to predict the a* value of the breast
meat. The model fit statistics used to predict a* using the MARS algorithm
are given in Table 4.
Table
4. Model 2 goodness of fit criteria and GCV values according to order of
interactions (for a*).
Order of int. |
Maximum number of BF |
Number of BF |
Number of terms |
GCV |
R2 |
Adj. R2 |
SDratio |
RMSE |
MAD |
2 |
80 |
10 |
7 |
2.689 |
0.803 |
0.718 |
0.443 |
1.186 |
1.025 |
2 |
90 |
10 |
7 |
2.689 |
0.803 |
0.718 |
0443 |
1.186 |
1.025 |
2 |
100 |
10 |
7 |
2.689 |
0.803 |
0.718 |
0.443 |
1.186 |
1.025 |
3 |
80 |
12 |
8 |
2.619 |
0.738 |
0.702 |
0.540 |
1.447 |
1.102 |
3 |
80 |
12 |
8 |
2.619 |
0.738 |
0.702 |
0.540 |
1.447 |
1.102 |
3 |
80 |
12 |
8 |
2.619 |
0.738 |
0.702 |
0.540 |
1.447 |
1.102 |
4 |
100 |
40 |
19 |
0.242 |
0.999 |
0.992 |
0.031 |
0.082 |
0.057 |
The
results of the MARS model including the basis function and the coefficients are
presented in Table 5. A MARS model with 23 basis functions and 4-way interactions
was selected as the most suitable model. For this model, the parameters were calculated
as follows: GCV=3.011, R2=0.999, Adj. R2=0.992, SDratio=0.031,
RMSE=0.082 and MAD=0.057.
Table 5. Prediction
results of the Model 2 MARS algorithm (for a*).
|
Basic function |
Coefficient |
|
Constant
(Intercept) |
13.621 |
BF1 |
max(0; b-12.75) |
-3.690 |
BF2 |
max(0; 12.75-b) |
2.701 |
BF3 |
max(0; 38.7-L) |
35.313 |
BF4
BF5
BF6
BF7
BF8
BF9
BF10
BF11
BF12
BF13
BF14
BF15
BF16
BF17
BF18 |
max(0; Golden)
max(0; b-12.46)* max(0; Golden)
max(0; 12.46-b)* max(0; Golden)
max(0; 38.7-L)* max(0; Golden)
max(0; 39.64-L)* max(0; Golden)
max(0; 12.46-b)* max(0; Golden)* max(0; Male)
max(0; pH-6.33)
max(0; 6.33-pH)
max(0; b-12.24)
max(0; pH-6.38)* max(0; Golden)
max(0; 6.38-pH)* max(0; Golden)
L*max(0;
6.33-pH)
max(0; 38.7-L)*pH
max(0; 38.7-L)* max(0; Male)
max(0; Male) |
1.521
-3.397
-1.401
3.353
-2.055
1.357
23.286
-821.001
9.254
-7.872
-20.650
22.809
-5.826
-1.675
1.791 |
The
MARS equation of Model 2 according to these results was as follows.
a= 13.6 + 1.52 * Golden + 1.79 * Male + 35.3 * max(0, 38.7- L) + 9.25 * max(0, b -12.2)+ 2.7 * max(0, 12.8 - b) -3.69 * max(0, b
- 12.8) - 821 * max(0, 6.33 - pH)+ 23.3 * max(0, pH -
6.33) + 22.8 * L * max(0, 6.33 -pH) - 5.83 * max(0, 38.7 - L) * pH + 3.35 * max(0, 38.7 - L) * Golden - 2.06 * max(0, 39.6 - L) * Golden +0.318 * max(0, L - 39.6) * Golden - 1.67 * max(0, L - 38.7) * Male -1.4 * max(0, 12.5 - b) * Golden - 3.4 * max(0, b - 12.5) *Golden - 20.7 * max(0, 6.38 - pH) * Golden - 7.87 * max(0, pH - 6.38) * Golden + 1.36 * max(0, b - 12.5) * Golden* Male
b* (yellow color) value: A MARS algorithm was created by selecting variety, sex,
L*, a* and pH as independent variables to predict the b* value of the breast meat in quails. The model fit statistics for the MARS algorithm
are given in Table 6.
The
results of the MARS model including the basis function and the coefficients are
presented in Table 7. A MARS model with 21 basis functions and 3-way
interactions was obtained as the best model. For this model, the parameters
were found as follows: GCV=0.029, R2=0.999, Adj. R2=0.996,
SDratio=0.132, RMSE=0.038 and MAD=0.026.
Table
6. Model 3 goodness of fit criteria and GCV values according to order of
interactions (for b*).
Order of int. |
Maximum number of BF |
Number of BF |
Number of terms |
GCV |
R2 |
Adj. R2 |
SDratio |
RMSE |
MAD |
2 |
80 |
6 |
5 |
0.946 |
0.919 |
0.897 |
0.533 |
0.621 |
0.480 |
2 |
90 |
6 |
5 |
0.946 |
0.919 |
0.897 |
0.533 |
0.621 |
0.480 |
2 |
100 |
6 |
5 |
0.946 |
0.919 |
0.897 |
0.533 |
0.621 |
0.480 |
3 |
80 |
42 |
21 |
0.029 |
0.999 |
0.996 |
0.132 |
0.038 |
0.026 |
3 |
90 |
42 |
21 |
0.029 |
0.999 |
0.996 |
0.132 |
0.038 |
0.026 |
3 |
100 |
42 |
21 |
0.029 |
0.999 |
0.996 |
0.132 |
0.038 |
0.026 |
Table 7. Prediction
results of the Model 3 MARS algorithm (for b*).
|
Basic function |
Coefficient |
|
Constant |
-10.003 |
BF1 |
max(0; a-15.89) |
0.763 |
BF2 |
max(0; L-31.69) |
0.264 |
BF3 |
max(0; a-15.89)*max(0;
Wild-type) |
2.737 |
BF4 |
max(0; L-31.69)*max(0;
Wild-type) |
2.226 |
BF5 |
max(0; L-31.69)*max(0;
pH-6.16)*max(0; Wild-type) |
-2.727 |
BF6 |
max(0; a-15.89)*max(0;
Dark-Brown) |
0.521 |
BF7 |
max(0; Dark-Brown) |
16.0004 |
BF8 |
max(0; L-31.69)*max(0;
Dark-Brown) |
-0.0009 |
BF9 |
max(0; a-15.89)*max(0;
pH-6.16)*max(0; Wild-type) |
2.653 |
BF10 |
max(0; L-31.69)*max(0;
pH-6.16) |
0.521 |
BF11 |
max(0; L-31.69)*max(0;
pH-6.16)*max(0; Female) |
-0.892 |
BF12 |
max(0; Golden) |
17.459 |
BF13 |
max(0; a-15.89)*max(0;
Wild-type)*max(0; Female) |
-9.330 |
BF14 |
max(0; L-31.69)*max(0;
Wild-type)*max(0; Female) |
5.656 |
BF15 |
max(0; Female) |
0.849 |
BF16 |
max(0; a-19.02)*max(0;
Female) |
-0.180 |
BF17 |
max(0; 19.02-a)*max(0;
Female) |
0.029 |
BF18 |
max(0; L-31.69)*max(0;
Dark-Brown)*max(0; Female) |
0.066 |
BF19 |
max(0; L-31.69)*max(0;
a-15.89)*max(0; Wild-type) |
-0.368 |
BF20 |
max(0; pH-6.38)*max(0;
Female) |
2.649 |
The
MARS equation obtained for Model 3 according to these results was as follows.
b*=-10.0031+0,763*max(0;
a-15.89)+0.264*max(0; L-31.69)+2.737*max(0; a-15.89)* max(0; Wild-type)+2.226*max(0; L-31.69)*max(0; Wild-type)-2.727*max(0;
L-31.69) *max(0; pH-6.16)*max(0; Wild-type)+0.521*max(0;
a-15.89)*max(0; Dark-Brown)+16.0004*max(0; Dark-Brown)-0.0009*max(0;
L-31.69)*max(0; Dark-Brown)+ 2.653*max(0; a-15.89)*max(0;
pH-6.16)*max(0; Wild-type)+0.521*max(0; L-31.69) *max(0;
pH-6.16)-0.892*max(0; L-31.69)*max(0; pH-6.16)*max(0;
Female)+ 17.459*max (0; Golden)-9.330*max(0; a-15.89)*max(0;
Wild-type)*max(0; Female)+ 5.656*max (0; L-31.69)*max(0;
Wild-type)*max(0; Female) + 0.849*max(0; Female)- 0.180*max
(0; a-19.02)*max(0; Female)+0.029*max(0; 19.02-a)*max(0;
Female)+ 0.066*max(0; L-31.69)*max(0; Dark-Brown)*max(0;
Female)-0.368*max(0; L-31.69)*max(0; a-15.89) *max(0;
Wild-type)+2.649*max(0; pH-6.38)*max(0; Female).
DISCUSSION
The
use of the MARS model in the stock farming area is very limited. However, the results
obtained in the present study contain much more descriptive findings than commonly
used models. The model have been successfully used in the subjects of cattle
raising (Aytekin et al., 2018; Ertürk et al., 2018), sheep
raising (Karadas et al., 2017; Eyduran et al., 2017) and
beekeeping (Aksoy et al., 2018a, Aksoy et al., 2018b).
This
study presented detailed information on the definition of the color of the breast
meat in quails belonging to different varieties and sexes through the MARS model.
a*>15.89, b*>8.79, pH<6.38 and female quails had
a significant effect on the L* value of the breast meat in quails in
general. The factor that affected the L* the most was the basis function
with 3-way interactions where a*<19.02, b*>12.46 and
the quails were female.
The
a* value of the breast meat was positively influenced with
interaction L*>31.69 and b*>8.79. However, it was not
influenced by sex and the Wild-type variety.
The
variables that increased the b* value of breast meat the most were the
Golden variety, the Dark-Brown variety, and the L*> 31.69, Wild-type
variety and female quail interaction, respectively.
Conclusions: In
conclusion, in quails, the L* (Model 1) and b* (Model 3) values
were explained better by the MARS model with second degree interactions, while the
a* value (Model 2) was defined better by the model with first degree
interactions.
REFERENCES
- Aksoy, A., Y.E. Ertürk, E. Eyduran and M.M. Tariq (2018a). Comparing Predictive Performances of MARS and CHAID Algorithms for Defining Factors Affecting Final Fattening Live Weight in Cultural Beef Cattle Enterprises. Pakistan J. Zool., 50(6): 2179-2286.
- Aksoy, A., Y.E. Ertürk, S. Erdoğan, E. Eyduran and M.M. Tariq (2018b). Estimation of honey production in beekeeping enterprises from eastern part of Turkey through some data mining algorithms. Pakistan J. Zool., 50(6): 2199-2207.
- Aksoy, A., Y.E. Ertürk, S. Erdoğan, E. Eyduran and M.M. Tariq (2019). Utility of MARSAlgorithm for Describing Non-Genetic Factors Affecting Pasture Revenue of Morkaraman Breed and Romanov × Morkaraman F1 Crossbred Sheep under Semi Intensive Conditions. Pakistan J. Zool., 51(1): 235-240.
- Ali, M., E. Eyduran, M.M. Tariq, C. Tirink, F. Abbas, M.A. Bajwa, M.H. Baloch, A.H. Nizamani, A. Waheed, M.A. Awan, S.H. Shah, Z. Ahmad and S. Jan (2015). Comparison of artificial neural network and decision tree algorithms used for predicting live weight at post weaning period from some biometrical characteristics in harnai sheep. Pakistan J. Zool., 47: 1579-1585
- Aytekin, İ., E. Eyduran, K. Karadaş, R. Akşahan and I. Keskin (2018). Prediction of fattening final live weight from some body measurements and fattening period in young bulls of crossbred and exotic breeds using MARS data mining algorithm. Pakistan J. Zool., 50: 189-195.
- Bilal, T. and K. Bostan (1996). Bıldırcınlarda yaş ve cinsiyetin bazı karkas özellikleri ve kimyasal kompozisyonuna etkileri. İstanbul Üni. Vet. Fak. Derg. 22(2): 323-329.
- Boni, I., H. Nurul and I. Noryati (2010). Comparison of meat quality characteristics between young and spent quails. International Food Research Journal 17: 661-666.
- Celik, S. (2019). Comparing Predictive Performances of Tree-Based Data Mining Algorithms and MARS Algorithm in the Prediction of Live Body Weight from Body Traits in Pakistan Goats. Pakistan J. Zool., 51(4):1447-1456.
- Celik, S., and O. Yilmaz (2018). Prediction of Body Weight of Turkish Tazi Dogs using Data Mining Techniques: Classification and Regression Tree (CART) and Multivariate Adaptive Regression Splines (MARS). Pakistan J. Zool., 50: 575-583.
- Celik, S., E. Eyduran, A. Tatliyer, K. Karadas, M. K. Kara, A. Waheed (2018). Comparing Predictive Performances of some Nonlinear Functions and Multivariate Adaptive Regression Splines (MARS) for Describing the Growth of Daera Dın Panah (DDP) Goat in Pakistan. Pakistan J. Zool., 50: 1187-1190.
- Erturk, Y. E. (2018). Description of Factors Influencing Final Fattening Weight in Domestic Beef Cattle Breeds through Mars Algorithm. Pakistan J. Zool., 50: 1731-1737.
- Erturk, Y. E., A. Aksoy and M.M. Tariq (2018). Effect of selected variables identified by MARS on fattening final live weight of crossbred beef cattle in Eastern Turkey. Pakistan J. Zool., 50(4):1403-1412.
- Eyduran, E., M. Akin, S.P. Eyduran (2019). Application of Multivariate Adaptive Regression Splines in Agricultural Sciences through R Software. Nobel Bilimsel Eserler, ISBN: 978-605-2149-81-2.
- Eyduran, E., O. Akkus, M.K. Kara, C. Tirink and M.M. Tariq (2017). Use of multivariate adaptive regression splines (MARS) in predicting body weight from body measurements in Mengali rams. International Conference on Agriculture, Forest, Food, Food Sciences and Technologies (ICAFOF 15-17 May 2017 Cappadocia).
- Friedman, J. H. (1991). Multivariate Adaptive Regression Splines, Annals of Statistics, 19(1):1-67.
- Froning, G. W. (1995). Color of poultry meat. Poult Avian Biol Rev 6(1):83–93.
- Genchev, A., G. Mihaylova, S. Ribarski, A. Pavlov and M. Kabakchiev (2008). Meat quality and composition in Japanese quails. Trakia Journal of Sciences, 6(4):72-82.
- Grzesiak, W., R. Lacroix, J. Wójcik and P. Blaszczyk (2003). A comparison of neural network and multiple regression predictions for 305-day lactation yield using partial lactation records. Canadian J. Anim. Sci., 83: 307-310.
- Grzesiak, W. and D. Zaborski (2012). Examples of the use of data mining methods in animal breeding. Additional information is available at the end of the chapter. http://dx.doi.org/10.5772/50893
- Hejnowska M., K. Pudyszak and R. Luter (1999). Wpływ pochodzenia na mikrostrukturę mięśnia piersiowego powierzchownego (m. pectoralis superficialis) i niektóre cechy użytkowe przepiórek japońskich. App. Sci. Rep. 45:83-90.
- Jaturasitha, S., T. Srikanchai, M. Kreuzer and M. Wicke (2008). Differences in carcass and meat characteristics between chicken indigenous to northern Thailand (Black-boned and Thai native) and imported extensive breeds (Bresse and Rhode Island Red). Poultry Science, 87(1):160-9.
- Karadas, K., Y.E. Ertürk, E. Eyduran, A.K. Gürsoy and M.M. Tariq (2017). Predictive performances of CHAİD and MARS data mining algorithms in the establishment of relationship between live body weight and several morphological measurements of indigenous Mengali sheep and its economic importance. International Conference on Agriculture, Forest, Food, Food Sciences and Technologies (ICAFOF 15-17 May 2017 Cappadocia).
- Koronacki, J. and J. Ćwik (2005). Statistical learning systems. WNT, Warsaw.
- López, K. P., M.W. Schilling and A. Corzo (2011). Broiler genetic strain and sex effects on meat characteristics. Poultry Science 90(5):1105-1111. doi: 10.3382/ps.2010-01154.
- Mehaffey, J.M., S.P. Pradhan, J.F. Meullenet, J.L. Emmert, S.R. McKee and C.M. Owens (2006). Meat quality evaluation of minimally aged broiler breast fillets from five commercial genetic strains. Poultry Science, 85(5):902-8.
- Mir, N. A., A. Rafiq, F. Kumar, V. Singh and V. Shukla (2017). Determinants of broiler chicken meat quality and factors affecting them: A review. J Food Sci. Technol. 54(10): 2997–3009.
- Narinc, D., T. Aksoy, E. Karaman, A. Aygün, M.Z. Fırat and M.K. Uslu (2013). Japan,ese quail meat quality: characteristics, heritabilities, and genetic correlations with some slaughter traits. Poultry Science, 92:1735–1744.
- Nasirifar E, M. Talebi, A. Esmailizadeh, H. Moradian, S.S. Sohrabi and N. Askari (2016). A chromosome-wide QTL mapping on chromosome 2 to identify loci affecting live weight and carcass traits in F2 population of Japanese quail. Czech J. Anim. Sci., 61(6): 290–297.
- Northcutt, J. K. (2007). Factors affecting poultry meat quality. Cooperative Extension Service. The University of Georgia College of Agric. & Env. Sci. http://www.uga.edu.us.
- Oguz, I., M. Akşit, A. Önenç, Y. Gevrekçi, D. Özdemir and Ö. Altan (2004). Genetic variability of meat quality characteristics in Japanese quail (Coturnix coturnix japonica). Arch. Geflügelk. 68:176–181.
- Remignon, H., A.D. Mills, D. Guemene, V. Desrosiers, M. Garreau-Mills, M. Marche and G. Marche (1998). Meat quality traits and muscle characteristics in high or low fear lines of Japanese quails (Coturnix japonica) subjected to acute stress. J British Poultry Science. 39(3): 372-378
- Riegel, J., F. Rosner, R. Schmidt, L. Schuler and M. Wicke (2003). Investigation of meat quality of m. Pectoralis in male and female japanese quails (Coturnix japonica). Proceeding of the XVIth European Symposium on the Quality of Poultry Meat, 23-26 September 2003, Saint-Brieuc, France.
- Skiba, G., S. Raj, E. Poławska, B. Pastuszewska, G. Elminowska-Wenda, J. Bogucka and D. Knecht (2012). Meat Science 91(3): 339–346.
- Sahin, G., E. Eyduran, M. Türkoğlu and F. Şahin (2018). Estimation of global irradiation parameters at location of migratory birds in Iğdır, Turkey by means of MARS Algorithm. Pakistan J. Zool., 50(6):2317-2324.
- Takma. C., H. Atil and V. Aksakal (2012). Comparison of multiple linear regression and artificial neural network models goodness of fit to lactation milk yields. KafkasÜniv. Veteriner Fakültesi Dergisi., 18: 941-944.
- Tougan P. U., M. Dahouda, G.S. Ahounou, C.F.A. Salifou, M.T. Kpodekon, G.A. Mensah, D.N.F. Kossou, C. Amenou, C.E. Kogbeto, A. Thewis and A. K. I. Youssao (2013). Effect of breeding mode, type of muscle and slaughter age on technological meat quality of local poultry population of Gallus gallus species of Benin. Intl. J. Biosciences, 3(6):1-17.
- Willmott, C. and K. Matsuura (2005). Advantages of the mean absolute error (MAE) over the root mean square error (RMSE) in assessing average model performance, Clim. Res., 30: 79-82.
|
|
|
|
|