PLANT DIVERSITY AND PHYLOGENETIC COMMUNITY STRUCTURE ALONG ENVIRONMENTAL
GRADIENTS IN A TEMPERATE FOREST, SOUTH KOREA
Hyungho Kim1 Jung-Hwa Chun2 and Chang-Bae
Lee3*
1 Department
of Forest Environmental Sciences, Gyeongsang National University (Institute of
Agricultural and Life Science), Jinjudaero 501, Jinju 52828, Republic of Korea
2 Research Planning and Coordination Division,
National Institute of Forest Science, 57 Hoegiro, Dongdaemungu, Seoul 02455, Republic
of Korea
3 Department of Forestry, Environment and Systems (Creative Convergence Forest Science
Specialist Training Center),
Kookmin University, 77 Jeongneungro, Seongbukgu, Seoul 02707, Republic of Korea
*Corresponding Author’s
E-mail: kecolee@kookmin.ac.kr
ABSTRACT
Recently, species-centric approach
in biodiversity research have been complemented by phylogenetic approach to reflect
evolutionary history of species and to improve our understanding of community
assembly processes in plant communities. However, the study on species and
phylogenetic diversity along environmental gradients and the drivers are very
rare. In this context, the present study examined species, phylogenetic
diversity and phylogenetic community structures for vascular plants along two
elevation transects on the Mt. Seorak, South Korea, in 2011. We calculated species
richness and Faith’s phylogenetic diversity as diversity indices and net
relatedness index as a phylogenetic community structure index using vegetation
data from 130 plots with 400m2 in the size of each plot. We also
evaluated the effects of climatic and topographic factors on the diversity
patterns using multi-model inference and variation partitioning. From the
results of linear regression analysis, Species
richness and phylogenetic diversity have no relationship with elevation along
all the study transect. However, the main factors to control these diversity
patterns on the two transects were topographic factors. In addition, phylogenetic
community structures showed phylogenetic overdispersion and clustering depending
on the study transects, which are explained as results of biotic interactions
and environmental filtering by climatic and topographic factors. These results indicate
that niche-based deterministic processes such as environmental filtering and
interspecific interaction may be predominant in structuring community assembly
of vascular plants along local elevation gradients.
Key words: Climatic Factor, Plant Diversity, Community
Structure, Elevation, Topographic Factor.
https://doi.org/10.36899/JAPS.2020.4.0112
Published
online April 25, 2020
INTRODUCTION
Understanding of
regional and local variations in species diversity and the distribution was an important
issue in ecology and biogeography (Gaston, 2000) because this is essential
knowledge for the conservation and sustainability of biodiversity (Grytnes and
Vetaas, 2002; Storch et al., 2006; Sharma et al., 2019). In
recent decades, researches on the patterns of species distribution and the
determinants across environmental gradients such as latitude and elevation have
been a very popular filed in ecology and biogeography (Grau et al.,
2007; Kluge and Kessler, 2011; Lee et al., 2013). Especially, many
ecologists recognize mountainous ecosystems are a remarkable and unique system
to evaluate ecological theory and the processes (Gaston, 2000; Grau et al.,
2007). The elevation naturally formed in the mountains is a physically
important inherent factor for biological distribution patterns (Rahbek, 2005).
Especially, elevation affects to climatic factors which control the ecophysiological
adaptation of organisms including mammals (Rowe, 2009), birds (McCain, 2009),
invertebrates (Liew et al., 2010) and plants (Grytnes et al.,
2006). Many earlier studies explored the distribution of species diversity along
elevations and documented different patterns in many regions and taxa (Rahbek,
2005). Of these patterns, it is recognized that monotonic decline and hump-shaped
patterns of species diversity across elevation gradients are most common
(Rahbek, 2005).
Previous
studies on elevational diversity patterns mostly focused on species richness,
however, this species-centric approaches treat that all species is evolutionarily
and ecologically independent. Moreover, this approach has problems that may not
reflect information on the mechanisms driving evolutionary and functional
trajectories (Webb et al., 2002). In recent, to complement the
shortcomings of these species-centric approaches, community phylogenetics as a
new alternative approach was introduced to improve our knowledge of the
mechanism underlying the formation and change of biodiversity. Especially, many
ecologists started to use the new method to add meaningful insights into
researches on community ecology and evolution. They differentiated the relative
importance of deterministic and stochastic processes in structuring community
assembly in various taxa and regions (Kluge and Kessler, 2011; Dreiss et al.,
2015; Zhou et al.,
2018). First,
deterministic process mentioned that niche-based drivers such as habitat
filtering and interspecfic competition play a pivotal role in structuring the
species assemblages in local communities and induce different community
assemblies among various environmental conditions (Cadotte et al., 2011;
Swenson, 2011). For example, if the environmental filtering is the main
determinant of community assembly, species with specific traits are filtered to
enhance survival, growth and reproduction in specific environments and
co-occurring species within an assemblage should be more phylogenetically
related (i.e., phylogenetic clustering). However, if species interactions such
as competition drive the community assembly, a species should compete with
other species and lead to phylogenetically distant assemblages (Webb et al.,
2002; Yang et al., 2015; Worthy et al., 2019). In contrast,
stochastic process focuses on the role of accidental events such as dispersal
limitation, disturbance and local extinction in shaping species assemblages in
local communities and the process causes random species composition among local
communities (Kembel and Hubbell, 2006).
Although
there were several studies on phylogenetic community structures and their
mechanisms in community assemblies along environmental gradients in various
regions (Kluge and Kessler, 2011; Dreiss et al., 2015; Shooner et al.,
2018), there are still few studies to investigate the patterns of plant
community structure in phylogenetic insights and the underlying mechanisms
along elevational gradients. Moreover, these previous studies focused to
explain phylogenetic structures and patterns along large and broad elevation
gradients such as regional and continental scales and did not explore the
patterns and structures at smaller scales such as a local slope. However,
spatial scales can drive different biodiversity patterns (Jetz and Rahbek, 2002) and thus it is distinctly a need
to such small local-scale structures and patterns (Rahbek, 2005; Chun and Lee,
2013; Chun and Lee, 2018).
Under
these contexts, the main purposes of this study are 1) to examine and compare
the diversity patterns and community phylogenetic structures in vascular plant assemblages
along two elevation transects on the Mt. Seorak, South Korea, 2) to assess the
relative contributions of climatic factors including six temperate- and
precipitation-related factors and topographic factors such as topographic
position index (TPI), surface area ratio (SAR), slope and rocky area ratio
(RAR) on diversity patterns and community structures and lastly 3) to evaluate
which mechanism between deterministic and stochastic processes is the major
driver in shaping community structures of vascular plants.
MATERIALS AND METHODS
Study area and vegetation survey: The present study was implemented
from May to July in 2011 along two elevation transects on the Mt. Seorak (38° 00´–38° 15´N, 128° 10´–128° 40´E), South Korea (Fig. 1). The Mt.
Seorak is the third-highest mountain in South Korea. Korean government and UNESCO
designated the Mt. Seorak as a nature reserve in 1965 and a biosphere reserve
in 1982, respectively. The area of mountain is 163.6 km2 and the highest
peak, Daechungbong, exceeds 1700 m above sea level (a.s.l.). The mountain
contains gneiss and dissected granite and is characterized by steed ridges and
rocky areas. The annual mean precipitation and temperature approximately are 1340
mm and 13°C, respectively (Chun and Lee, 2013).
More than 1000 plant species have been documented in the mountain (Kong, 2007). The vegetation communities
along elevation gradients on the mountain is mainly divided into four vegetation
types by dominant tree species (Kong, 2007), as follows: (1) pine and temperate
deciduous forest dominated by Pinus densiflora Siebold & Zucc. and Rhododendron
mucronulatum D.Don ex G.Don under <500m a.s.l.; (2) coniferous and
temperate deciduous mixed forest dominated by P. koraiensis Siebold
& Zucc., Abies holophylla Maxim., Quercus mongolica Fisch. ex
Ledeb., Betula schmidtii Regel and Magnolia sieboldii K. Koch between
500–1100 m a.s.l.; (3) subalpine coniferous forest between
1100–1500 m a.s.l. dominated by Taxus cuspidate Siebold & Zucc., Thuja koraiensis Nakai, and A. nephrolepis (Trautv.)
Maxim.; and (4) alpine forest dominated by P. pumila (Pall.) Regel and R.
mucronulatum var. ciliatum Nakai. over 1500 m a.s.l. (Kong, 2007).
For
vegetation sampling, two transects with 100-m-width along elevation gradients
were installed using Osaek and Namgyori trails to Daechungbong on the mountain.
The lengths of the Osaek and Namgyori trails are about 5.3 km and 22.4 km,
respectively. We randomly established five plots every 100m interval along the two
transect and the area of each plot was 400 m2. Plant species and
coverage-based abundance with Braun-Blanquet's method (1965) were recorded in each
plot. Vegetation data was collected from 60 plots for the Osaek transect and 70
plots for the Namgyori transect in the Mt. Seorak. We observed a total of 235 plant species from
130 plots along the two transects. A total of 135 species were herbaceous plants
(57%), and woody species were 100 species (43%). A total of 164 and 211 plant
species were recorded along the Osaek and Namgyori transects, respectively.
Phylogenetic tree construction: Phylogenetic super-tree containing all
vascular plants recorded from field survey was generated by the plant phylogeny
database Phylomatic (Webb and Donoghue, 2005). The Phylomatic uses the consensus
tree (R20120829) from Angiosperm Phylogeny Group III (APG III) as a backbone. BLADJ
(branch length adjustment) algorithm used for the assignment of branch length
in the free software Phylocom 4.2 (Webb et al., 2008) to constrain the
internal nodes with available age estimates from Wikstrom et al. (2001)
and interpolated the other nodes for which direct age estimates are not
available (Bryant et al., 2008). The constructed phylogenetic tree was
used to calculate phylogenetic community structure for the two transects (Fig.
2).
Diversity and phylogenetic community
structure: We used species richness (i.e., number
of species) in a plot as a proxy of species diversity. Phylogenetic diversity
in a plot was calculated using Faith’s phylogenetic diversity (PD). PD is calculated
as the total branch lengths of all the species in a plot using the constructed
phylgenetic tree (Faith, 1992). Abundance weighted net relatedness index (NRI)
among co-existing species in a plot was also calculated to measure the
magnitude of phylogenetic clustering using Phylocom 4.2 (Webb et al.,
2008). The NRI was calculated as:

where
MPDsample indicates the mean value of pairwise phylogenetic distance
between all the species in a plot. The MPDrandom and SDrandom are the mean MPD and standard deviation of MPD from 1000 randomly generated
null models. Here, MDP emphasizes the deep phylogenetic structure in a
phylogeny and MDP is thought to have tree-wide sensitive patterns of
phylogenetic overdispersion than to the structure near the terminals (Webb et
al., 2002). As the deeper parts of the phylogeny used are well supported,
coming from APG III classification, there should not be any important bias in
NRI measurements caused by the limited tip resolution in the phylogeny used
(Swenson, 2011). And we used random shuffling null model based alteration of specie
names across the terminals in phylogenetic tree. This model randomly generates
the phylogenetic relatedness of species to one another, while maintain the
observed plant community matrix. Therefore, this model maintains the observed
levels of spatial distribution and number of species and abundance in each
randomization (Swenson et al., 2012).
Environmental factors: We included climatic factors in a
plot with digital climate maps produced by the Korea Meteorological Agency such
as annual mean temperature, temperature in January (the coldest month),
temperature in August (the hottest month), temperature of growing season (generally
May to August), annual mean precipitation and precipitation of growing season (Chun
and Lee, 2013). The spatial resolutions were 270m and 30 m for precipitation- and
temperature-related factors, respectively. And climate data were from 1971 to
2008 and from 1981 to 2009 for temperate- and precipitation-related data, respectively.
The log-transformation was used for two precipitation-related factors to attain normality for further
analysis.
We
also used topographic factors such as slope, RAR, TPI and SAR in each plot.
Although soil chemical and physical properties such as nutrient and moisture
contents often are employed as proxies of habitat factors in previous studies
(Moeslund et al., 2013), these topographic factors in this study was used because Mt.
Seorak contains many rocky areas and various terrains and thus the collection of
soil samples is mostly impossible in the mountain. Many vascular plants in the
mountain do not inhabit in such steep and rocky locations (Kong, 2007).
Therefore, we judged these factors will be more crucial to the growth and existence
of plants than other habitat factors. Slopes from the four corners and the
center of a plot using an inclinometer were measured and the mean value of
slopes measured in a plot was used. For the calculation of RAR, four lines
penetrative the center of the plot were established and divided the lines into
segments of 1-m length. And then we quantified the ratio of substrates
including rock and soil intercepting a segment. The proportion of rock substrates
intercepting 200 segments in a plot was identified as RAR. Slope and RAR were log-transformed
and arcsine square root transformed for further analysis, respectively. The other two topographic factors such
as TPI and SAR were calculated for each plot using a triangular irregular
network model using the digital elevation model (DEM) with a 1:25,000 digital terrain
map. SAR is a method to calculate rugosity (i.e., a type of roughness). The rugosity
represents basically the ratio of surface area to the planar area (Jenness,
2004). TPI is calculated as the topographic position relative to the
surrounding locations. The negative and positive values indicates ravines and ridges,
respectively (De Reu et al., 2013). DEM with 30-m resolution was used for
calculation of TPI and SAR with ArcGIS.
To
reduce the number of factors and co-variation and possible redundancy in
environmental variable data, two separate principal component analysis (PCA) were
performed on each set of climatic and topographic factors (Table 1). As new
climatic factors, the first two PCA axes were used that is retained 96.1% of
the total variation from the original factors. The PCA-derived climatic factors
were named PC1clim and PC2clim. And the first three PCA
axes were used as new topographic factors that is retained 91.7% of the total
variation from the original factors. The PCA-derived topographic factors were
named PC1topo, PC2topo and PC3topo.
Statistical analysis: Pearson correlation coefficient was
used to examine the relationship between species richness and PD. Simple linear
regression analysis was employed to examine the relationships between elevation
and species richness, PD and NRI. And simple ordinary least squares (OLS) models were performed to explore
the effects of each factor such as PC1clim,
PC2clim, PC1topo, PC2topo and PC3topo on diversity and community
structure indices. Simple conditional autoregressive (CAR) analysis was also
used in addition to simple OLS models. Recent papers recommend autoregressive
analyses because the models can exclude the estimates of invalid parameter and inflation
of type I errors caused by spatial autocorrelation (Jetz and Rahbek, 2002). Multi-model inference with model
averaging approach was also used to evaluate the relative contribution of
environmental factors controlling patterns of species and phylogenetic
diversity and phylogenetic community structure, respectively. Model averaging
simultaneously examines several combinations to seek the best model set using
the Akaike’s information criterion (Legendre, 1993; Burnham and Anderson,
2002). This approach quantifies the relative contribution of each explanatory
factor with summation of the Akaike weights across all possible models. Moreover, studies focusing on mechanisms
driving diversity distribution commonly use multiple regressions-related
statistical models (Diniz-Filho et al., 2003). We also employed
variation partitioning with partial regression (Legendre and Legendre, 1998)
with the five factors divided into two factors, climatic (PC1clim and
PC2clim) and topographic (PC1topo, PC2topo and
PC3topo) factors to separate and compare the explanatory power of
the new factors. PAST 2.17 and SAM 4.0 was used for statistical analyses in this
study.
RESULTS
From the results
of PCA with six climatic factors (Table 1), PC1clim had positive
correlation with four temperature-related factors and PC2clim was
correlated with two precipitation-related factors. PC1topo had
positive correlation with slope and SAR. PC2topo was correlated with
RAR and TPI and PC3topo had an important relationship with TPI.
These results indicate that PC1clim, PC2clim are temperature-
and precipitation-related climatic factors, respectively. Although it is
difficult to clearly distinguish topographic factors, PC1topo, PC2topo and PC3topo are slope-, rocky- and TPI-related topographic factors,
respectively.
In
elevational diversity patterns, although species richness and PD along the Osaek
transect decrease with increasing elevation (Fig. 3a and c), the relationships
were statistically not significant (P > 0.05). Species richness and
PD along the Namgyori transect also showed not significant relationships with
increasing elevation (Fig. 3b and d). The patterns of NRIs as a measurement of
phylogenetic community structure showed negative and positive correlations with
increasing elevation for the Osaek and Namgyori transects, respectively (Fig.
3e and f). And species richness and PD had strong linear relationships along
the two transects (Fig. 4a and b), whereas species richness did not show
significant relationships with NRI (Fig. 4c–f).
This result indicates that species richness can be used a substitute of PD but
not the index of phylogenetic community structure such as NRI.
Based
on simple OLS models, species richness and PD of vascular plants were
significantly predicted by PC3topo and PC1topo along the
Osaek and Namgyori transects, respectively (Table 2). These results indicate
that topographic factors are more important than climatic factors for species
richness and PD on the both transects. PC1clim was the most
important variable to explain the pattern of NRI along the Osaek transect,
whereas three environmental factors such as PC2clim, PC1topo and PC2topo were important as predictors for NRI along the Namgyori
transect. The results of simple CAR models were similar to those of simple OLS
models (Table 2). These results represent that the influence of spatial
autocorrelation for the patterns of diversity along the elevation gradients is
not significant in the study transects. The results of multi-model inference
also were similar to those of simple OLS and CAR models although there were
some exceptions for species richness and PD on the Namgyori transect and NRI on
the Osaek transect (Table 3). That is, PC1topo and PC3topo were important for predicting species richness and all the topographic factors
(i.e., PC1topo, PC2topo and PC3topo) were
important for PD along the Namgyori transect. Climatic factors such as PC1clim and PC2clim were significant predictors for the pattern of NRI along
the Osaek transect. Moreover, the results of variation partitioning also
re-emphasized those of the multi-model inference (Fig. 5). The pure effects of
topographic factors were higher than those of climatic factors for species
richness and PD of vascular plants along the study transects, whereas climatic
factors had higher pure effects than topographic factors for NRI as a
phylogenetic community structure index.
Table
1. Results of two separate principal component (PC) analyses with six climatic
and four topographic factors for the two study transects on the Mt. Seorak.
|
PC1 |
PC2 |
PC3 |
PC4 |
PC5 |
PC6 |
Climatic factors |
|
|
|
|
|
|
Explained variance (%) |
88.36 |
7.82 |
3.67 |
0.11 |
0.04 |
<
0.01 |
Loadings |
|
|
|
|
|
|
Mean annual temperature |
0.42 |
0.30 |
–0.06 |
0.12 |
–0.22 |
–0.82 |
Mean temperature in January
(the
coldest month) |
0.39 |
0.30 |
–0.78 |
–0.12 |
0.20 |
0.30 |
Mean temperature in August
(the
hottest month) |
0.42 |
0.22 |
0.53 |
–0.26 |
0.66 |
0.05 |
Mean temperature from May to August (growing season) |
0.42 |
0.29 |
0.33 |
0.31 |
–0.54 |
0.49 |
Mean annual precipitation |
–0.39 |
0.63 |
0.07 |
–0.61 |
–0.27 |
0.01 |
Mean precipitation of growing season |
–0.40 |
0.54 |
–0.01 |
0.66 |
0.34 |
–0.01 |
Topographic factors |
|
|
|
|
|
|
Explained
variance (%) |
41.78 |
26.25 |
23.65 |
8.32 |
– |
– |
Loadings |
|
|
|
|
|
|
Slope |
0.70 |
–0.12 |
–0.12 |
–0.70 |
– |
– |
Rocky area ratio |
0.26 |
0.67 |
–0.65 |
0.26 |
– |
– |
Topographic position index |
0.14 |
0.68 |
0.71 |
–0.11 |
– |
– |
Surface area ratio |
0.66 |
–0.27 |
0.24 |
0.66 |
– |
– |
Table
2. Coefficient of determination (R2) and significance level from
simple ordinary least squares (OLS) and conditional autoregressive (CAR) models
for environmental factors and the indices of plant diversity and community
structure along the study transects on the Mt. Seorak, South Korea.
Study transect |
Index |
OLS model |
CAR model |
PC1climate |
PC2climate |
PC1topo |
PC2topo |
PC3topo |
PC1climate |
PC2climate |
PC1topo |
PC2topo |
PC3topo |
Osaek |
SR |
0.01 |
0.02 |
<0.01 |
<0.01 |
0.13** |
0.01 |
0.01 |
<0.01 |
<0.01 |
0.13** |
|
PD |
<0.01 |
0.02 |
<0.01 |
<0.01 |
0.11** |
<0.01 |
0.01 |
<0.01 |
<0.01 |
0.11** |
|
NRI |
0.29*** |
0.04 |
<0.01 |
<0.01 |
<0.01 |
0.28*** |
0.04 |
<0.01 |
<0.01 |
<0.01 |
Namgyori |
SR |
<0.01 |
0.03 |
0.10* |
0.02 |
0.04 |
<0.01 |
0.03 |
0.10* |
0.01 |
0.04 |
|
PD |
<0.01 |
0.03 |
0.08* |
0.03 |
0.02 |
<0.01 |
0.03 |
0.07* |
0.02 |
0.02 |
|
NRI |
0.02 |
0.14** |
0.08* |
0.07* |
0.02 |
<0.01 |
0.13** |
0.07* |
0.06* |
0.02 |
Significance
levels are * p < 0.05; ** p < 0.01; *** p < 0.001.
Table 3. Beta coefficient and
importance value of each variable based on multi-model inference in determining
plant diversity and phylogenetic community structure indices along the study
transects.
Study
transect |
Variable |
Species
richness |
Phylogenetic
diversity |
Net
relatedness index |
Beta
coefficient |
Importance
value |
Beta
coefficient |
Importance
value |
Beta
coefficient |
Importance
value |
Osaek |
PC1clim |
0.145 |
0.384 |
0.092 |
0.295 |
0.566* |
1* |
PC2clim |
–0.075 |
0.271 |
–0.109 |
0.309 |
–0.246* |
0.772* |
PC1topo |
0.092 |
0.289 |
0.091 |
0.29 |
–0.066 |
0.271 |
PC2topo |
–0.052 |
0.255 |
–0.067 |
0.27 |
0.097 |
0.309 |
PC3topo |
0.359* |
0.959* |
0.328* |
0.92* |
0.094 |
0.305 |
Namgyori |
PC1clim |
–0.022 |
0.269 |
0.022 |
0.278 |
–0.013 |
0.265 |
PC2clim |
–0.141 |
0.407 |
–0.159 |
0.46 |
–0.362* |
0.982* |
PC1topo |
–0.223* |
0.672* |
–0.190* |
0.555* |
–0.194* |
0.592* |
PC2topo |
–0.179 |
0.49 |
–0.197* |
0.555* |
0.256* |
0.791* |
PC3topo |
0.215* |
0.655* |
0.178* |
0.524* |
0.129 |
0.389 |
Beta
coefficient is the standardized slope and the value indicates the relative
importance for a factor in the model. Importance values are the posterior
porbabilities over the set of hypotheses, representing the sum of the Akaike
weights for each model containing the particular predictor in the model set. The
factors that are included in the best model from all 31 possible models are
highlighted with asterisk(*) and the best models are based on
minimizing corrected Akaike information criterion among all possible models.
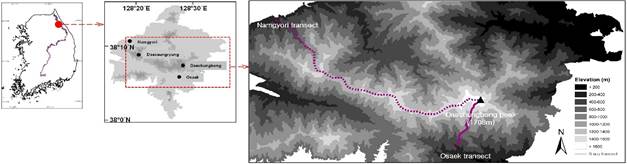
Fig. 1.
Location and topography of the Mt. Seorak and the two study transects in South
Korea.
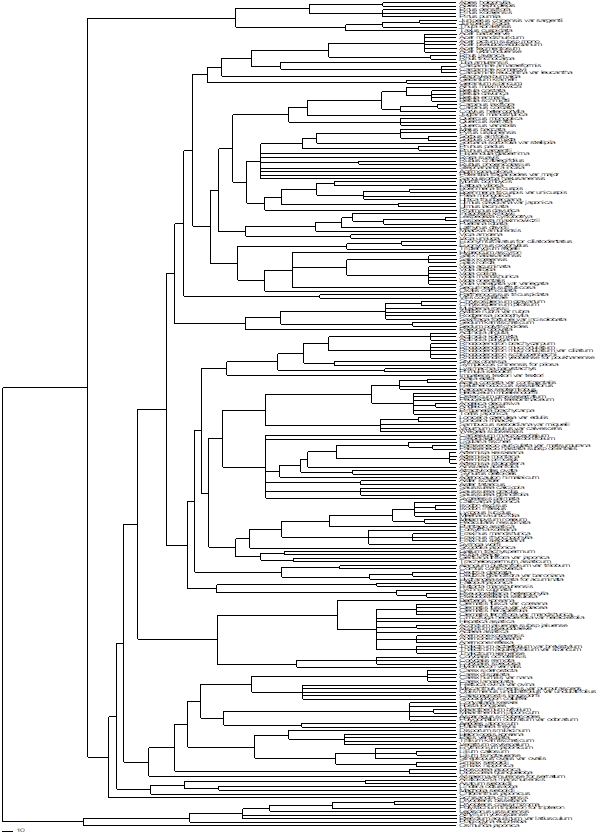
Fig. 2. Phylogenetic
trees constructed in the present study for vascular plants from the two study transects
in the Mt. Seorak.
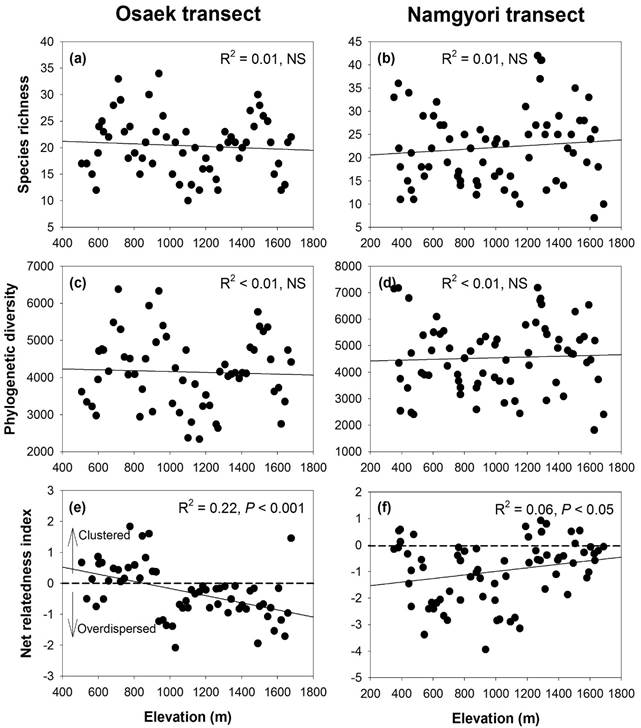
Fig 3. Relationships of (a–b) species richness, (c–d) Faith’s phylogenetic diversity and (e–f) net relatedness index for vascular
plants with elevation along the two study transects on the Mt. Seorak.
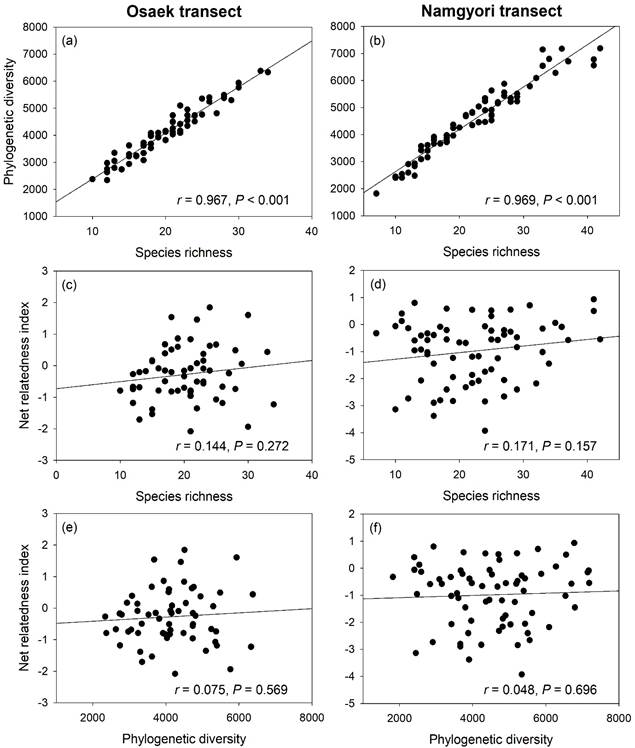
Fig. 4. Relationships between species richness,
phylogenetic diversity and net relatedness index of vascular plants along the
two study transects, Osaek and Namgrori, on the Mt. Seorak.

Fig. 5. Variation partitioning in (a) species
richness, (b) Faith’s phylogenetic diversity and (c) net relatedness index of
vascular plants explained by climatic and topographic factors along the two
study transects on the Mt. Seorak.
DISCUSSION
This study
examined the elevational patterns and the drivers of plant diversity and
phylogenetic structure at small spatial scale using field data along two
transects on a Korean temperate forest. Primary local-scale data is a crucial material
for understanding of the within-domain diversity in geographic levels, whereas
secondary large-scale data is important to interpret the tendency across
spatial grains (Oommen and Shanker, 2005; Rahbek, 2005). Thus, this study has
strength and benefit on examining diversity patterns, the structure of community
assembly and the drivers related to an empirical data collected on local-scale
levels.
For
plant diversity patterns, although species richness and PD of vascular plants
showed no relationships (or random fluctuation) with increasing elevation along
the study transects, two diversity indices had same tendency and strong
correlation. The results indicate the possibility of species richness as a
proxy of PD. Indeed, many studies documented that species richness highly and
significantly correlated with Faith’s phylogenetic diversity (Bryant et al.,
2008; Davies and Buckley, 2011; Li et al., 2015; Yang et al.,
2015). And, in a previous extensive review study, Rahbek (2005) reported that unimodal
elevation patterns were recorded approximately 50%, approximately 25% were a
monotonic decline and the remaining 25% of the gradients were other patterns.
This study shows that the elevation patterns of vascular plants along the
transects belong to other patterns (i.e., remaining 25%) based on the Rahbek’s study.
This study also represents that if species richness can be used as a substitute
of PD, the general types of elevation patterns in species diversity can be
applied for PD. The key drivers for these diversity patterns such as species
richness and phylogenetic diversity were topographic factors. In general, topographic factors are thought as crucial factors
regulating local-scale diversity (Moeslund et al., 2013) and can produce
a complex and various mosaic structures of substrates, hydrology and biogeochemistry
(Bledsoe and Shear, 2000; Sharma et al., 2019).
Furthermore, these factors formed by topography may also affect plant distribution
patterns through environmental constraints on plant survival and growth and
offer a various habitats, as well as buffering against environmental change
(Moeslund et al., 2013).
In
phylogenetic community structure analysis, the NRIs showed contrasting patterns
between the two transects although the main drivers of the patterns were
similar as climatic factors. The NRIs with increasing elevation showed
monotonic decreasing and increasing patterns along the Osaek and Namgyori
transects, respectively. These results indicate phylogenetic overdispersion for
the Osaek transect and phylogenetic clustering for the Namgyori transect are
major processes structuring community assemblies of vascular plants. According
to niche-based deterministic theory, phylogenetic overdispersion is generally
explained by biotic interactions such as competition and facilitation to
structure community diversity (Bryant et al., 2008; Chun and Lee, 2019).
Callaway et al. (2002) documented that these biotic interactions are
crucial drivers in alpine plant community assembly, with a shift from
competition at low elevations with less stressful environmental conditions to facilitation
at high elevations with high environmental stress. Therefore, increased
overdispersion at higher elevations suggests that the effect of facilitation on
plant communities at high elevations is stronger than the effect of competition
at low elevations (Bryant et al., 2008; Chun and Lee, 2019; Worthy et al., 2019). An alternative explanation is
that the evolution of functional traits necessary to tolerate harsh
environments at high elevations has occurred independently in distantly related
species (i.e., convergent evolution in high alpine plants). In contrast to phylogenetic
overdispersion, phylogenetic clustering is commonly explained as a result of
environmental filtering (Webb et al., 2002; Bryant et al., 2008;
Chun and Lee, 2018) because ecological traits are generally phylogenetically
conserved (i.e., phylogenetic niche conservatism) and more closely related
species are expected to be more ecologically similar (Webb et al., 2002;
Shooner et al., 2018). Therefore, this study supports the hypothesis
that niche-based deterministic process such as environmental filtering and
biotic interactions are a major underlying mechanism to form community
structures in plant community assemblies along these transects, although the
environmental drivers for phylogenetic community structures between the study
transects may be somewhat different (Table 3). As main drivers to regulate
phylogenetic community structure, climatic factors for the Osaek transect and climatic and topographic factors for the Namgyori transect were
important (Table 3 and Fig. 5). Although climatic factors were simultaneously good
predictors, the roles of climatic factors are likely to be different between
the two transects. Along the Osaek transect, interspecific facilitation or the
sorting of distantly related species with functional traits to tolerate harsh
conditions (i.e., cold temperature) at high elevations may be influenced by
climate. Moreover, only the restricted number of different lineages to avoid
competition among similar lineages should be able to cause a lower NRI values
and thus phylogenetic overdispersion occurs at high elevations (Pellissier et
al., 2012; Yang et al., 2015; Zhou et al., 2018). On the
other hand, along the Namgyori transect, climatic and topographic factors simultaneously may filter closely
related species with the traits to cope with harsh climatic condition and
topographic stress at high elevations and produce more phylogenetic clustering.
This
study explored the patterns of plant diversity, phylogenetic community
structure and their underlying mechanisms along two local elevation transects,
the Osaek and Namgyori transects, using primary data in Mt. Seorak. Although
the patterns of species richness and phylogenetic diversity showed no
relationship with elevation along all transects, the main drivers of these
diversity patterns were topographic factors. Two diversity indices showed same tendency and strong
correlation along all study transects. The results support that the possibility
of species richness as a proxy of phylogenetic diversity. Moreover, phylogenetic community
structures showed phylogenetic overdispersion and phylogenetic clustering along
the Osaek and Namgyori transects, respectively. These plant community
structures were regulated by climatic factors on the Osaek transect and climatic
and topographic factors for the Namgyori transect. These findings suggest that
niche-based deterministic processes such as environmental filtering and
interspecific interaction may be predominant in structuring community assembly
of vascular plants along local elevation gradients and the specific processes
for plant community structures may differ between nearby transects even in a
same mountain ecosystem.
Conclusions: In conclusion, the main drivers to
regulate the elevational patterns of species richness and phylogenetic
diversity with increasing elevation were topographic factors along the study transects,
Osaek and Namgyori transects, on the Mt Seorak, South Korea. Species richness can be used as a
substitute of phylogenetic diversity but not net relatedness index as an index
to measure phylogenetic community structure. Phylogenetic
community structures were different between the study transects (i.e.,
phylogenetic overdispersion for for the Osaek and phylogenetic clustering for
the Namgory transect) and these community structures were regulated by climatic
factors on the Osaek transect and climatic and topographic factors for the
Namgyori transect. These results suggest that niche-based deterministic
processes such as environmental filtering and interspecific interaction are
predominant in structuring community assembly of vascular plants along local
elevation gradients on the study mountain.
Acknowledgments: We greatly thank Mr. Cho, Sung-Yeol
and Mr. Ahn, Hyo-Hyun for their full support and cooperation during the
fieldwork and the data analysis in this study. Thanks are also due to Dr. Cho,
Hyun-Je and Dr. Shin, Jun-Hwan for their encouragement and support. This study was carried out with the
support of ‘R&D Program for Forest Science Technology (Project No.
2019150C10-1923-0301)’ provided by Korea Forest Service (Korea Forestry
Promotion Institute).
REFERENCES
- Bledsoe, B.P. and T.H. Shear (2000). Vegetation along hydrologic and edaphic gradients in a North Carolina coastal plain creek bottom and implications for restoration. Wetlands 20: 126–147.
- Braun-Blanquet, J. (1965). Plant Sociology. Hafner Publishing; New York (USA) 472 p.
- Bryant, J.B., C. Lamanna, H. Morlon, A.J. Kerkhoff, B.J. Enquist and J.L. Green (2008). Microbes on mountainsides: contrasting elevational patterns of bacterial and plant diversity. Proceedings of the National Academy of Sciences USA 105: S11505–11511.
- Burnham, K.P. and D.R. Anderson (2002). Model selection and inference: a practical information-theoretic approach. 2nd Ed. Springer-Verlag; New York (USA). 488 p.
- Cadotte, M.W., K. Carscadden and N. Mirotchnick (2011). Beyond species: functional diversity and the maintenance of ecological processes and services. Journal of Applied Ecology 48: 1079–1087.
- Callaway, R.M., R.W. Brooker, P. Choler, Z. Kikvidze, C.J. Lortie, R. Michalet, L. Paolini, F.I. Pugnaire, B. Newingham, E.T. Aschehoug, C. Armas, D. Kikodze and B.J. Cook (2002). Positive interactions among alpine plants increase with stress. Nature 417: 844–848.
- Chun, J.H. and C.B. Lee (2013). Assessing the effects of climate change on the geographic distribution of Pinus densiflora in Korea using Ecological Niche Model. Korean Journal of Agriculture and Forest Meteorology 15: 291–233. (In Korean)
- Chun, J.H. and C.B. Lee (2018). Partitioning the regional and local drivers of phylogenetic and functional diversity along temperate elevational gradients on an East Asian peninsula. Scientific Reports 8: 2853 doi: 10.1038/s41598-018-21266-4
- Chun, J.H. and C.B. Lee (2019). Temporal changes in species, phylogenetic, and functional diversity of temperate tree communities: insights from assembly patterns. Frontiers in Plant Science 10: 294 doi: 10.3389/fpls.2019.00294
- Davies, T.J. and L.B. Buckley (2011). Phylogenetic diversity as a window into the evolutionary and biogeographic histories of present-day richness gradients for mammals. Philosophical Transactions of the Royal Society B 366: 2414–2425.
- De Reu, J., J. Bourgeois, M. Bats, A. Zwertvaegher, V. Gelorini, P. De Smedt, W. Chu, M. Antrop, P. De Maeyer, P. Finke and M. Van Meirvenne (2013). Application of the topographic position index to heterogeneous landscapes. Geomorphology 186: 39–49.
- Diniz-Filho, J.A.F., L.M. Bini and B.A. Hawkins (2003). Spatial autocorrelation and red herrings in geographical ecology. Global Ecology and Biogeography 12: 53–64.
- Dreiss, L.M., K.R. Burgio, L.M. Cisneros, B.T. Klingbeil, B.D. Patterson, S.J. Presley and M.R. Willig. (2015). Taxonomic, functional and phylogenetic dimensions of rodent biodiversity along an extensive tropical elevational gradient. Ecography 38: 876–888.
- Faith, D.P. (1992). Conservation evaluation and phylogenetic diversity. Biological Conservation 61: 1–10.
- Gaston, K.J. (2000). Global patterns in biodiversity. Nature 405: 220–227.
- Grau, O., J.A. Grytnes, H.J.B. Birks (2007). A comparison of altitudinal species richness patterns of bryophytes with other plant groups in Nepal, Central Himalaya. Journal of Biogeography 34: 1907–1915.
- Grytnes, J.A. and O.R. Vetaas (2002). Species richness and altitude: a comparison between null models and interpolated plant species richness along the Himalayan altitudinal gradient, Nepal. American Naturalist 159: 294–304.
- Grytnes, J.A., Heegaard, E. and P.G. Ihlen (2006). Species richness of vascular plants, bryophytes, and lichens along an altitudinal gradient in western Norway. Acta Oecologica 29: 241–246.
- Jenness, J.S. (2004). Calculating landscape surface area from digital elevation models. Wildlife Society Bulletin 32: 829–839.
- Jetz, W. and C. Rahbek (2002). Geographic range size and determinants of avian species richness. Science 297: 1548–1551.
- Kembel, S.W. and S.P. Hubbell (2006). The phylogenetic structure of a neotropical forest tree community. Ecology 87: S86–99.
- Kluge, J. and M. Kessler (2011). Phylogenetic diversity, trait diversity and niches: species assembly of ferns along a tropical elevational gradient. Journal of Biogeography 38: 394–405.
- Kong, W.S. (2007). Biogeography of Korea plants. GeoBook Publishing; Seoul (Republic of Korea). 335 p.
- Lee, C.B., J.H. Chun, H.K. Song and H.J. Cho (2013). Altitudinal patterns of plant species richness on the Baekdudaegan Mountains, South Korea: mid-domain effect, area, climate, and Rapoport’s rule. Ecological Research 28: 67–79.
- Legendre, P. (1993). Spatial autocorrelation: trouble or new paradiam? Ecology 85: 1659–1673.
- Legendre, P. and L. Legendre (1998). Numerical ecology. 2nd Ed. Elsevier; Amsterdam (Netherland). 853 p.
- Li, R., N.J.B. Kraft, H. Yu and H. Li (2015). Seed plant phylogenetic diversity and species richness in conservation planning within a global biodiversity hotspot in eastern Asia. Conservation Biology 29: 1552–1562.
- Liew, T.S., M. Schilthuizen and M. Lakim (2010). The determinants of land snail diversity along a tropical elevational gradient: insularity, geometry and niches. Journal of Biogeography 37: 1071–1078.
- McCain, C.M. (2009). Global analysis of bird elevational diversity. Global Ecology and Biogeography 18: 346–360.
- Moeslund, J.E., L. Arge, P.K. Bøcher, T. Dalgaard and J.C. Svenning (2013). Topography as a driver of local terrestrial vascular plant diversity patterns. Nordic Journal of Botany 31: 129–144.
- Oommen, M.A. and K. Shanker (2005). Elevational species richness patterns emerge from multiple local mechanisms in Himalayan woody plants. Ecology 86: 3039–3047.
- Pellissier, L., N. Alvarez, A. Espíndola, J. Pottier, A. Dubuis, J.N. Pradervand and A. Guisan (2012). Phylogenetic alpha and beta diversities of butterfly communities correlated with climate in the western Swiss Alps. Ecography 35: 1–10.
- Rahbek, C. (2005). The role of spatial scale and the perception of large-scale species-richness patterns. Ecology Letters 8: 224–239.
- Rowe, R.J. (2009). Environmental and geometric drivers of small mammal diversity along elevational gradients in Utah. Ecography 32: 411–422.
- Sharma, N., M.D. Behera, A.P. Das and R.M. Panda (2019). Plant richness pattern in an elevational gradient in the Eastern Himalaya. Biodiversity and Conservation 28: 2085–2104.
- Shooner, S., T.J. Davies, P. Saikia, J. Deka, S. Bharali, O.P. Tripathi, L. Singha, M.L. Khan and S. Dayanandan (2018). Phylogenetic diversity patterns in Himalayan forests reveal evidence for environmental filtering of distance lineages. Ecosphere 9: e02157. doi: 10.1002/ecs2.2157
- Storch, D., R.G. Davies, S. Zajíček, C.D. Orme, V. Olson, G.H. Thomas, T.S. Ding, P.C. Rasmussen, R.S. Ridgely, P.M. Bennett, T.M. Blackburn, I.P. Owens and K.J. Gaston (2006). Energy, range dynamics and global species richness patterns: Reconciling mid-domain effects and environmental determinants of avian diversity. Ecology Letters 9: 1308–1320.
- Swenson, N.G. (2011). The role of evolutionary processes in producing biodiversity patterns, and the interrelationships between taxonomic, functional and phylogenetic diversity. American Journal of Botany 98: 472–480.
- Swenson, N.G., J.C. Stegen, S. Davies, D.L. Erickson, J. Forero-Montaña, A.H. Hurlbert, W.J. Kress, J. Thompson, M. Uriarte, S.J. Wright and J.K. Zimmerman. (2012). Temporal turnover in the composition of tropical tree communities: functional determinism and phylogenetic stochasticity. Ecology 93: 490–499.
- Webb, C.O., D.D. Ackerly, M.A. McPeek and M.J. Donoghue (2002). Phylogenies and community ecology. Annual Review of Ecology and Systematics 33: 475–505.
- Webb, C.O. and M.J. Donoghue (2005). Phylomatic: tree assembly for applied phylogenetics. Molecular Ecology Notes 5: 181–183.
- Webb, C.O., D.D. Ackerly and S. Kembel (2008). Phylocom: software for the analysis of phylogenetic community structure and trait evolution. Bioinformatics 24: 2099–2101.
- Wikstrom, N., V. Savolainen and M.W. Chase (2001). Evolution of angiosperms: calibrating the family tree. Proceedings of the Royal Society London B 268: 2211–2220.
- Worthy, S.J., R.A.A. Paz, Á.J. Pérez, A. Reynolds, J. Cruse-Sanders, R. Valencia, J.A. Barone and K.S. Burgess (2019). Distribution and community assembly of trees along an Andean elevational gradient. Plants 8: 326. doi: 10.3390/plants8090326
- Yang, J., N.G. Swenson, G. Zhang, X. Ci, M. Cao, L. Sha, J. Li, J.W.F. Slik and L. Lin (2015). Local-scale partitioning of functional and phylogenetic beta diversity in a tropical tree assemblage. Scientific Reports 5: 12731. doi: 10.1038/srep12731
- Zhou, Y., S. Chen, G. Hu, G. Mwachala, W. Yan and Q. Wang (2018). Species richness and phylogenetic diversity of seed plants across vegetation zones of Mount Kenya, East Africa. Ecology and Evolution 8:8930–8939.
|