THE SMALL-SCALE SPATIAL PATTERN OF 12 TRACE ELEMENTS AND HEAVY METALS OF SUBMERGED PLANTS, WATER AND SEDIMENT IN A SHALLOW LAKE
Q. Wang1, 2, J. Fu3, 4, H. Liu5 and Y. Cao2*
1Jiangxi Academy of Sciences, Nanchang 330096, China; 2Key Laboratory of Aquatic Botany and Watershed Ecology, Wuhan Botanical Garden, Chinese Academy of Sciences, Wuhan 430074, China; 3Research Center for Ecology and Environment of Qinghai-Tibetan Plateau, Tibet University, Lasa 850000, China; 4College of Science, Tibet University, Lasa 850000, China; 5Key Laboratory of Ecological Impacts of Hydraulic Projects and Restoration of Aquatic Ecosystem of Ministry of Water Resources, Institute of Hydroecology, Ministry of Water Resources and Chinese Academy of Sciences, Wuhan 430079, China
Corresponding Author’s Email: caoyu@wbgcas.cn
ABSTRACT
Heavy metals are difficult for bio-degradation and can produce severe damages to aquatic ecosystem and human society. Many previous studies of trace elements and heavy metals have been conducted in shallow lakes, but these studies usually considered one large lake as a homogeneous state, where the small-scale heterogeneous spatial patterns due to lake morphology or dominant macrophytes communities in the lake were usually ignored. Here, we conducted a detailed field survey in a large shallow Lake Liangzihu (divided into three sub-lakes) to investigate the spatial pattern of 12 trace elements and heavy metals in sediment, water and submerged plants. Our results indicated a low risk of heavy metal contamination in Lake Liangzihu based on the ecological risk index (< 100). However, As, Pb and Zn in sediment was evaluated as the moderate or stronger contamination in some sites according to the geoaccumulation index, and Ni in water was close to the safety levels of Chinese drinking water guidelines. Moreover, three metals (Ba and Sr in sediment and Ni in water) differed at the sub-lake level, and strong variation of most metals in sediment, water and submerged plants was found at the sampling site level, indicating an important role of small-scale spatial pattern. Concentrations of most of these elements in sediment were positively correlated, but not so for the elements in water, suggesting different processes for the dynamics of the trace element and heavy metals between the two media. There were also significant differences of the bioconcentration factor (BCF) among the four plant species. Vallisneria natans had strongest BCF for As, and Ceratophyllum demersum had the highest BCF for Ni. But the transfer factor between the sediment and the water did not differ among three sub-lakes. In summary, our study highlights the role of spatial heterogeneity in the distribution of trace elements and heavy metals in large shallow lakes, which should be considered in the safety assessment of heavy metals in shallow lakes.
Keywords: trace element, heavy metal, Lake Liangzihu, small-scale, As, Pb, Ni
http://doi.org/10.36899/JAPS.2022.2.0455
Published first online August 13. 2021
INTRODUCTION
The development of human society has brought many types of toxic matter to fresh water bodies, such as heavy metals, persistent organic pollutants, microplastics, etc (Liu and Li. 2011; Arinaitwe et al. 2016; Zhou et al. 2020). Since heavy metals are very difficult for bio-degradation, they exist for a long term in the ecosystem and enrich through food chain leading severe consequences to the safety and biodiversity of the aquatic system (Cao et al. 2019; Wagner. 1992). Thus, the research on trace elements and heavy metals is highly important.
Several previous studies have focused on the condition of several heavy metals in multiple shallow lakes of the mid-lower reaches of the Yangtze river involving the status of water, sediment and submerged macrophytes (Liu and Li. 2011; Xing et al. 2013; Jiang et al. 2017). Recently another study revealed the heavy metals of surface sediment in the Qinghai-tibet plateau lakes (Guo et al. 2018), and based on 8 heavy metals (Cu, Zn, Cd, Pb, Cr, Co, Ni, and As) in 18 lakes, they revealed that the distributions of the heavy metals showed no clear spatial pattern on the plateau. However, these studies analyzed the status of heavy metals on a macro-scale spatial pattern. As for large shallow lakes, the morphological traits such as depth and shoreline characteristics constitute the spatial heterogeneity of the lakes (Liu et al. 2010). There was also small-scale variation in lakes due to the distribution of macrophyte communities or distinct economical modes e.g. fishery or tourism, but the potential effects of the small-scale variation of trace element and heavy metals in the large shallow lakes were always ignored (Liu and Li. 2011; Xing et al. 2013).
The main objectives of this study are to investigate the small-scale spatial pattern and safety assessment of trace elements and heavy metals in a large shallow lake. We aim to (1) quantitatively record the spatial pattern of heavy metals in the whole shallow lake including water, sediment, and submerged plants and (2) analyze the relationship of dissolved trace element and heavy metal between submerged plants and water or sediment.
MATERIALS AND METHODS
Sample’s site: The Lake Liangzihu is a typical clear shallow lake dominated by submerged macrophytes, with a drainage area of 227.15 km2, being the second largest lake in Hubei province and the 13th largest lake in Chinese freshwater lakes (Wang and Dou. 1998). The lake shoreline has reached to 470 km consist of several bay areas (Figure S1). The depth of lake water ranges between 1.2 m and 4.2 m, with an average of 2.8 m. The lake has been divided into three sub-lakes: Zhonghu (ZH), Qianjiangdahu (QH) and Donghu (DH), which are naturally connected but develop in different economical modes (Figure S1, Table S1). The ZH and DH area mainly develops in aquaculture (e.g. crabs for ZH and fishery for DH). The QH area has been exploited around Liangzi island and famous for the tourism.
The Lake Liangzihu belongs to north subtropical climate zone (Wang and Dou. 1998). Annual mean precipitation in the region is 1263.4 mm, and the annual mean atmosphere temperature is ca. 17 ℃. The lake water is relatively clear that the transparency distance ranged 0.3-1.4 m, and the mean value is 0.8 m. The main ions in the water consisted of HCO3-, SO42-, Cl-, Ca2+, Mg2+, K+, Na+ and etc. (Wang and Dou. 1998).
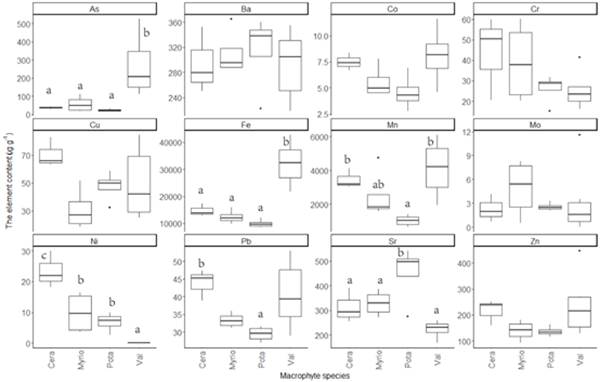
Figure 1Trace elements and heavy metal concentrations in the macrophytes in the Lake Liangzihu, China (unit in µg g -1). Cera, Myrio, Pota and Val refer to Ceratophyllum demersum, Myriophyllum spicatum, Potamogeton macckianus and Vallisneria natans, respectively. Different letters indicate the significant difference between the plant species.
Table 4. The transfer factor (TF, x10-5) between the sediment and the water of trace element and heavy metals in the Lake Liangzihu, China.
Site ID |
Ba |
Co |
Cu |
Fe |
Mn |
Ni |
Pb |
Sr |
1 |
4.93 |
36.52 |
117.23 |
0.06 |
0.00 |
42.99 |
0.00 |
151.88 |
2 |
2.87 |
23.13 |
71.11 |
0.02 |
0.00 |
20.84 |
0.00 |
113.25 |
3 |
2.79 |
22.22 |
73.49 |
0.06 |
0.27 |
19.96 |
0.00 |
123.44 |
4 |
3.44 |
27.60 |
79.64 |
0.05 |
0.68 |
26.39 |
0.00 |
107.04 |
5 |
3.73 |
33.82 |
124.88 |
0.04 |
0.00 |
30.74 |
3.88 |
97.29 |
6 |
4.31 |
31.77 |
103.15 |
0.02 |
0.01 |
29.68 |
1.28 |
108.79 |
7 |
7.68 |
25.07 |
96.69 |
0.12 |
0.10 |
25.68 |
19.67 |
181.18 |
8 |
9.89 |
28.56 |
77.13 |
0.00 |
0.16 |
21.92 |
0.00 |
228.69 |
9 |
8.29 |
25.43 |
65.78 |
0.03 |
0.69 |
18.47 |
0.00 |
196.36 |
10 |
8.56 |
24.32 |
77.37 |
0.03 |
0.12 |
18.56 |
1.29 |
233.73 |
11 |
5.19 |
24.75 |
68.72 |
0.00 |
0.00 |
17.51 |
0.00 |
222.81 |
12 |
3.94 |
25.56 |
64.82 |
0.04 |
0.00 |
17.50 |
0.00 |
166.67 |
13 |
4.65 |
26.03 |
60.52 |
0.02 |
0.00 |
19.21 |
0.00 |
203.63 |
14 |
4.32 |
26.09 |
79.90 |
0.01 |
0.00 |
23.13 |
0.00 |
147.06 |
Sampling methods: For the determination of the concentrations of trace elements and heavy metals, each sub-lake area was sampled along the major axis of the water body, and the sampling locations were distributed along the direction of water flow (Figure S1). Site 1, 2, 3 and 4 were in ZH, site 5, 6, 7, 8 and 9 in QH, site 10, 11, 12, 13 and14 in DH. Sediment and water samples were collected at each sampling site. The sample on each site was mixed by three samples collected within ca. 200 meters around the sample point, and therefore a total of 28 samples (14 water samples and 14 sediment samples) were obtained. Water samples were taken superficially at the depth of 50 cm, and each site of water sample is 3000 ml. A high-density polyethylene (HDPE) container pre-washed with 0.1 mol L-1 HCl and rinsed with deionized water was used to preserve the samples in 4 ℃. In the lab, the water sample was filtered by GF/F filter with a pore diameter of 0.45 μm and stored at -20 ℃ till further analysis (Demirak et al. 2006). Sediment samples (ca. 500 g fresh weight) were collected by a columnar sampler from ca. 10 cm below surface sediment, sealed in plastic bags, preserved in 4 ℃ and taken back to the laboratory within 24 hours. The sediment samples were naturally dry by wind, and ca. 100 g of each sample was ground into powder and then sifted through 100# mesh nylon sieve to remove large particles. After the pre-treatment, sediment samples were oven-dried in 80 ℃ for 72 hours and saved for further analysis. For the determination of trace elements and heavy metals in submerged plants, a self-designed plant sampler with the quadrat area of 20 cm * 20 cm was randomly sampled four times per site (More details in Xing et al. 2013). Vallisneria natans was the dominant species in ZH, and V. natans and Potamogeton macckianus were the dominant ones in QH, and for DH, Ceratophyllum demersum
Data analysis: To satisfy the presumption of ANOVA, the data of the concentrations of the chosen 12 elements in sedimen and Myriophyllum spicatum were two commonly-found species. The harvested macrophytes samples were treated the same as the sediment samples.
Figure S1. The sampling sites distributed in three sub-lake area in Lake Liangzihu, China. The island near site 9 is called Liangzi Island, which is a tourism area.
The concentrations of As, Ba, Co, Cr, Cu, Fe, Mn, Mo, Ni, Pb, Sr, Zn in the water, sediment and submerged plant samples were determined by inductively coupled plasma atomic emission spectrometry (IRIS Intrepid II XSP DUO, Thermo Electron, USA). More details had been shown in Liu and Li (2011). The samples of sediment and plant were digested with concentrated HNO3, HF and HClO4 prior to the determination, and the purity of these chemicals is analytical reagent. Method validation and quality control of samples were completed according to the standard reference material (SRM, SPEX CertiPrep Inc, USA). The standard recovery rate of standard reference metals was within the range of 90%~110%, and the regular standard deviation (RSD) of samples were < 5%. All the samples were measured within two weeks.
For the determination of water physical-chemistry, temperature, conductivity (C), pH and ORP were measured by YSI ProPlus multiple parameter meter in situ. TP, NH4-N, NO3-N, TN, turbidity, and COD were determined according to Huang et al. (1999).
Table 1 Trace elements and heavy metal concentrations of lake sediment and the ecological risk index (RI) in the Lake Liangzihu, China (unit in μg g-1). RI was evaluated according to the concentrations of As, Cr, Cu, Mn, Ni, Pb, and Zn.
|
Site ID
|
Ba
|
As
|
Co
|
Cr
|
Cu
|
Fe
|
Mn
|
Mo
|
Ni
|
Pb
|
Sr
|
Zn
|
RI
|
|
1
|
584.7
|
9.19
|
19.99
|
45.48
|
40.69
|
28290
|
385.9
|
0.3
|
21.17
|
28.74
|
75.06
|
155
|
37.92
|
|
2
|
930.8
|
24.12
|
32.43
|
85.11
|
67.50
|
38040
|
846.8
|
2.27
|
40.78
|
50.16
|
99.78
|
187.3
|
67.04
|
|
3
|
898.6
|
20.27
|
31.95
|
74.09
|
65.18
|
36300
|
957.5
|
0.62
|
42.59
|
39.51
|
95.59
|
179.2
|
60.68
|
|
4
|
599.5
|
18.53
|
26.81
|
52.34
|
66.05
|
36600
|
907.4
|
nda
|
29.93
|
45.68
|
109.3
|
185.0
|
59.69
|
|
5
|
509.9
|
17.14
|
23.36
|
46.84
|
43.08
|
32840
|
740.8
|
nd
|
23.10
|
30.96
|
106.9
|
134.8
|
48.85
|
|
6
|
547.0
|
32.40
|
23.92
|
63.08
|
50.22
|
34520
|
902.0
|
nd
|
24.93
|
39.04
|
119.5
|
203.6
|
63.56
|
|
7
|
591.0
|
17.55
|
25.93
|
68.60
|
54.09
|
35860
|
1086.0
|
nd
|
30.37
|
37.62
|
113.7
|
173.8
|
55.53
|
|
8
|
618.1
|
16.76
|
26.26
|
72.53
|
66.12
|
35300
|
876.4
|
nd
|
30.56
|
40.49
|
125.5
|
176.6
|
57.04
|
|
9
|
727.7
|
21.06
|
27.92
|
86.89
|
81.63
|
36700
|
1174.0
|
nd
|
36.27
|
43.33
|
153.8
|
214.0
|
65.48
|
|
10
|
716.3
|
15.93
|
25.90
|
80.66
|
65.53
|
35730
|
1153.0
|
2.69
|
36.64
|
30.94
|
124.5
|
193.9
|
54.75
|
|
11
|
1015
|
36.39
|
29.49
|
83.47
|
77.71
|
36240
|
1018.0
|
0.64
|
43.41
|
43.27
|
114.0
|
271.3
|
73.62
|
|
12
|
996.8
|
22.75
|
30.52
|
80.79
|
75.44
|
36290
|
1133.0
|
0.35
|
44.57
|
48.30
|
106.8
|
204.2
|
67.75
|
|
13
|
946.3
|
23.05
|
30.35
|
91.46
|
76.84
|
35010
|
1016.0
|
0.47
|
41.64
|
45.65
|
104.6
|
193.1
|
66.89
|
|
14
|
849.2
|
15.39
|
27.60
|
64.79
|
64.96
|
33640
|
1067.0
|
0.97
|
35.45
|
41.40
|
108.8
|
168.1
|
56.53
|
|
Mean
(SD)
|
752.2
(181.3)
|
20.75
(6.97)
|
27.32
(3.49)
|
71.15
(14.98)
|
63.93
(12.68)
|
35097
(2363)
|
947.41
(205.34)
|
1.04
(0.92)
|
34.39
(7.83)
|
40.36
(6.54)
|
111.27
(17.65)
|
188.56
(31.51)
|
59.67
(9.05)
|
a ‘nd’ means that the concentration is lower than the detection level.
water, sediment, and submerged plants were log (x+1) transformed if needed. The difference between three sub-lakes were analyzed by one-way ANOVA. Due to unbalanced experiment design, Type-III method was used for post-hoc test and multiple comparison. The Pearson method was used to investigate the correlation between the metals within the same medium (water, sediment or macrophyte) and between different media of the same metal. The significance level was set as 0.05. All the analyses were conducted in SPSS 19.0.
We used the geoaccumulation index (Igeo) to evaluate the degree of the pollution from heavy metal in the lake sediment (Muller. 1969; Loska et al. 1997) based on the following equation:

where Cn and Bn refer to the determined concentration of chosen elements (or heavy metals) and the background value in the sediment, respectively. According to the lithospheric effect, a coefficient 1.5 is used as correction factor (Zhang et al. 2014). We classified the Igeo into seven different levels: 1) practically uncontaminated; 2) uncontaminated to moderately contaminated; 3) moderately contaminated; 4) moderately to heavily contaminated; 5) heavily contaminated; 6) heavily to extremely contaminated; 7) extremely contaminated according to the calculated values < 0, 0~1, 1~2, 2~3, 3~4, 4~5 and ≥5, respectively (Muller. 1969; Jiang et al. 2017).
Igeo only focused on the effect of human-driven activities on the metals and was calculated based on single metal, however. The bioavailability and combined effects of several metals could be evaluated by the ecological risk index (RI) (Wang et al. 2015). We calculate RI by the following formula:

Ci is the determined concentration for heavy metal in the lake sediment, and Cbi is the background concentration for heavy metal, which is the same as the values of Bn for Igeo. The values of Tri for As, Cu, Ni, Pb, Cr, Mn, and Zn are 10, 5, 5, 5, 2, 2, and 1, respectively (Hakanson. 1980). We divided RI into four levels: the low risk, the moderate risk, the considerable risk, and the high risk based on the ranges of <150, 150~300, 300~600, > 600. Ecological risk assessment of RI was not involved with Ba, Co, Fe, Mo and Sr due to lack of the values of Tri for them.
In addition to the two indicators above, bioconcentration factor (BCF) and transfer factor (TF) were also used as the indicators to reflect the accumulation of metals in macrophytes and the exchange of metals between water and sediment, respectively. BCF and TF were calculated based on the following equations:
  and and
where Cm refers to the concentration of heavy metal in the submerged plants, and Cs refers to the concentration of heavy metal in the sediment, and Cw refers to the concentration of heavy metal in the water.
RESULTS
The water physical-chemistry indicated an oligotrophic-mesotrophic state of the Lake Liangzihu, with lower nutrient levels and better water quality in the ZH area (Table S2).
The concentrations of trace element and heavy metals in the sediment, water and macrophytes in Lake Liangzihu: The concentrations of trace element and heavy metals in the sediment were shown in Table 1. There was large variation between the concentrations of metals from the fourteen sites. For example, As were lowest as 9.19 μg g-1 in site 1 and ca.
Table 2. Geoaccumulation index (Igeo) values for trace elements and heavy metal concentrations in lake sediments in the Lake Liangzihu, China. Bn is the background concentrations.
|
Site ID
|
Ba
|
As
|
Co
|
Cr
|
Cu
|
Fe
|
Mn
|
Mo
|
Ni
|
Pb
|
Sr
|
Zn
|
|
Bn
|
610
|
1.9
|
32
|
63
|
38
|
50800
|
780
|
2
|
57
|
15
|
490
|
86
|
|
Igeo
|
|
|
|
|
|
|
|
|
|
|
|
|
|
1
|
-0.65
|
1.69
|
-1.26
|
-1.06
|
-0.49
|
-1.43
|
-1.60
|
-3.32
|
-2.01
|
0.35
|
-3.29
|
0.26
|
|
2
|
0.02
|
3.08
|
-0.57
|
-0.15
|
0.24
|
-1.00
|
-0.47
|
-0.40
|
-1.07
|
1.16
|
-2.88
|
0.54
|
|
3
|
-0.03
|
2.83
|
-0.59
|
-0.35
|
0.19
|
-1.07
|
-0.29
|
-2.27
|
-1.01
|
0.81
|
-2.94
|
0.47
|
|
4
|
-0.61
|
2.70
|
-0.84
|
-0.85
|
0.21
|
-1.06
|
-0.37
|
nda
|
-1.51
|
1.02
|
-2.75
|
0.52
|
|
5
|
-0.84
|
2.59
|
-1.04
|
-1.01
|
-0.40
|
-1.21
|
-0.66
|
nd
|
-1.89
|
0.46
|
-2.78
|
0.06
|
|
6
|
-0.74
|
3.51
|
-1.00
|
-0.58
|
-0.18
|
-1.14
|
-0.38
|
nd
|
-1.78
|
0.80
|
-2.62
|
0.66
|
|
7
|
-0.63
|
2.62
|
-0.89
|
-0.46
|
-0.08
|
-1.09
|
-0.11
|
nd
|
-1.49
|
0.74
|
-2.69
|
0.43
|
|
8
|
-0.57
|
2.56
|
-0.87
|
-0.38
|
0.21
|
-1.11
|
-0.42
|
nd
|
-1.48
|
0.85
|
-2.55
|
0.45
|
|
9
|
-0.33
|
2.89
|
-0.78
|
-0.12
|
0.52
|
-1.05
|
0.00
|
nd
|
-1.24
|
0.95
|
-2.26
|
0.73
|
|
10
|
-0.35
|
2.48
|
-0.89
|
-0.23
|
0.20
|
-1.09
|
-0.02
|
-0.16
|
-1.22
|
0.46
|
-2.56
|
0.59
|
|
11
|
0.15
|
3.67
|
-0.70
|
-0.18
|
0.45
|
-1.07
|
-0.20
|
-2.23
|
-0.98
|
0.94
|
-2.69
|
1.07
|
|
12
|
0.12
|
3.00
|
-0.65
|
-0.23
|
0.40
|
-1.07
|
-0.05
|
-3.10
|
-0.94
|
1.10
|
-2.78
|
0.66
|
|
13
|
0.05
|
3.02
|
-0.66
|
-0.05
|
0.43
|
-1.12
|
-0.20
|
-2.67
|
-1.04
|
1.02
|
-2.81
|
0.58
|
|
14
|
-0.11
|
2.43
|
-0.80
|
-0.54
|
0.19
|
-1.18
|
-0.13
|
-1.63
|
-1.27
|
0.88
|
-2.76
|
0.38
|
|
Mean
(SD)
|
-0.32
(0.35 )
|
2.79 (0.48)
|
-0.82
(0.19)
|
-0.44
(0.33)
|
0.14
(0.31)
|
-1.12 (0.10)
|
-0.35 (0.41)
|
-1.97
(1.17)
|
-1.35 (0.35)
|
0.82
(0.25)
|
-2.74 (0.23)
|
0.53
(0.23)
|
a ‘nd’ means that the concentration is lower than the detection level.
four times higher as 36.39 μg g-1 in site 11. For Mo, the concentration was below the detection levels from site 4 to site 9; however, it was > 2 μg g -1 in site 2 and site 10. When grouping all the sites into three sub-lakes, only two metals show significant difference between three sub-lakes: Ba was higher in DH than in QH (F = 6.660, p < 0.05), and Sr was higher in QH than in ZH (F = 4.690, p < 0.05).
In contrast, RI was generally low in all the sites (<100), which indicated a low risk level for the chosen seven metals (Table 1). Igeo also showed strong variation among the sampling sites except for the stably low values of Fe (-1.12 ± 0.10) and Co (-0.82 ± 0.19) (Table 2). The Igeo score of some heavy metals indicated a relatively high risk. For most sampling sites, As was at the levels of moderate or stronger contamination based on the Igeo score. Meanwhile, Pb and Zn in most sites were uncontaminated to moderately contaminated, and Pb in site 2 and Zn in site 11 were moderately contaminated. The Igeo score of Ba and Sr showed significant differences among three sub-lakes (F = 6.813, p < 0.05 for Ba, and F = 5.130, p < 0.05 for Sr), and the same differences were found for the concentrations of the two metals as shown above.
In the lake waters, the concentrations of Ba were within the range of 19.0-61.3 µg L-1, and the concentrations of Co ranged within 6.3-7.9 µg L-1, and the concentrations of Cu, Ni and Sr in the lake waters were 46.5-53.8, 6.7-9.1 and 104-302 µg L-1, respectively (Table 3). Fe, Mn, Pb and Zn varied strongly between different sites with the highest values as 44.6 (site 7), 8.1 (site 9), 7.4 (site 7) and 0.6 µg L-1 (site 7), respectively and lowest values below the detection level. Ni concentrations were close to the safety levels according to the WHO and Chinese drinking water guidelines (10 µg L-1). One-way ANOVA revealed that Ni was significantly higher in ZH than in other two sub-lakes, and none of other elements differed among three sub-lakes (F = 8.158, p < 0.01).
The content of As, Fe, Mn, Ni Pb and Sr in the submerged plants differed significantly among four plant species, but not for the other six metals (Figure 1, Table S3). The content of As and Fe was highest 63.2 ± 54.5 µg g-1 and 32.2 ± 7.8 mg g-1 in Vallisneria natans, respectively (F > 6.32, p < 0.01 for both). Mn was ca. three times in V. natans and C. demersum higher than in P. macckianus (F = 5.11, p < 0.05). As for Ni, it was the highest in C. demersum, intermediate in P. macckianus and M. spicatum, lowest in V. natans (F = 20.37, p < 0.001). Meantime, C. demersum had the higher Pb concentration than P. macckianus (F = 4.34, p < 0.05), but P. macckianus had the higher Sr concentration than the other three species (F = 8.22, p < 0.01).
The correlation analysis between the trace element and heavy metals in sediment and in water: The content of As, Mo and Sr did not significantly correlate with other elements in the sediment except for between As and Zn and between Sr and Mn (Figure 2). While other elements showed positive correlation between each other, e.g. Ni was strongly related with Ba, Co, Cr and Cu. In contrast, the elements in the water did not significantly correlate between each other with few exceptions (Figure 3). Ni showed the negative correlation with Ba, Cu and Sr. There were also significantly positive relationships between Fe and Pb and between Ba and Sr.

Figure 2. The correlation between the trace elements and heavy metal concentrations of sediments in the Lake Liangzihu, China. The larger circle means the stronger correlation, and the cross means no significance at the level of 0.05.
Table 3. Trace elements and heavy metal concentrations of lake waters in the Lake Liangzihu, China (unit in µg L-1), and the standard levels for some metals are listed.
|
Site ID
|
|
Ba
|
As
|
Co
|
Cr
|
Cu
|
Fe
|
Mn
|
Mo
|
Ni
|
Pb
|
Sr
|
Zn
|
|
1
|
|
28.8
|
nd
|
7.3
|
nd
|
47.7
|
16.8
|
nd
|
nd
|
9.1
|
nd
|
114
|
nd
|
|
2
|
|
26.7
|
nd
|
7.5
|
nd
|
48
|
9.4
|
nd
|
nd
|
8.5
|
nd
|
113
|
nd
|
|
3
|
|
25.1
|
nd
|
7.1
|
nd
|
47.9
|
23.4
|
2.6
|
nd
|
8.5
|
nd
|
118
|
nd
|
|
4
|
|
20.6
|
nd
|
7.4
|
nd
|
52.6
|
19.4
|
6.2
|
nd
|
7.9
|
nd
|
117
|
nd
|
|
5
|
|
19.0
|
nd
|
7.9
|
nd
|
53.8
|
11.8
|
nd
|
nd
|
7.1
|
1.2
|
104
|
nd
|
|
6
|
|
23.6
|
nd
|
7.6
|
nd
|
51.8
|
7.5
|
0.1
|
nd
|
7.4
|
0.5
|
130
|
nd
|
|
7
|
|
45.4
|
nd
|
6.5
|
nd
|
52.3
|
44.6
|
1.1
|
nd
|
7.8
|
7.4
|
206
|
0.6
|
|
8
|
|
61.1
|
nd
|
7.5
|
nd
|
51
|
Nd
|
1.4
|
nd
|
6.7
|
nd
|
287
|
nd
|
|
9
|
|
60.3
|
nd
|
7.1
|
nd
|
53.7
|
9.4
|
8.1
|
nd
|
6.7
|
nd
|
302
|
nd
|
|
10
|
|
61.3
|
nd
|
6.3
|
nd
|
50.7
|
9.0
|
1.4
|
nd
|
6.8
|
0.4
|
291
|
nd
|
|
11
|
|
52.7
|
nd
|
7.3
|
nd
|
53.4
|
Nd
|
nd
|
nd
|
7.6
|
nd
|
254
|
nd
|
|
12
|
|
39.3
|
nd
|
7.8
|
nd
|
48.9
|
15.0
|
nd
|
nd
|
7.8
|
nd
|
178
|
nd
|
|
13
|
|
44.0
|
nd
|
7.9
|
nd
|
46.5
|
8.1
|
nd
|
nd
|
8.0
|
nd
|
213
|
nd
|
|
14
|
|
36.7
|
nd
|
7.2
|
nd
|
51.9
|
2.7
|
nd
|
nd
|
8.2
|
nd
|
160
|
nd
|
|
WHOa
|
|
|
700
|
50
|
2000
|
|
|
|
|
10
|
20
|
|
|
|
Chinab
|
|
700
|
10
|
|
50
|
1000
|
|
100
|
|
20
|
10
|
|
1000
|
|
CSWQSc
|
I
|
|
50
|
|
10
|
10
|
|
100
|
|
|
10
|
|
50
|
|
II
|
|
50
|
|
50
|
1000
|
|
100
|
|
|
10
|
|
1000
|
|
III
|
|
50
|
|
50
|
1000
|
|
100
|
|
|
50
|
|
1000
|
|
IV
|
|
100
|
|
50
|
1000
|
|
500
|
|
|
50
|
|
2000
|
|
V
|
|
100
|
|
100
|
1000
|
|
1000
|
|
|
100
|
|
2000
|
a WHO Drinking water guidelines (2004) b Chinese Drinking water guidelines (2005)
c Chinese surface water quality standards (CSWQS, GB3838-2002)
The bioconcentration factor (BCF) between the plants and the sediment and the transfer factor (TF) between the sediment and the water of trace element and heavy metals in Lake Liangzihu, China: The mean BCF of the four macrophytes were > 1 for As (0.83-42.10), Mn (0.80-6.71) and Sr (1.34-4.53), close to 1 for Pb and Zn and < 1 for Ba, Co, Cr, Cu, Fe and Ni (Table S4, Figure 4). For Mo, the BCF (within the range of 0 and 7.77) varied strongly, reflecting the large variation of the Mo concentrations in the sediment and macrophytes, which was not included in the further analysis. In addition, there were also different BCFs between four plant species (Figure 4). P. macckianus had the highest BCF for Ba among the four species (F = 5.01, p < 0.05) and higher BCF for Sr than V. natans (F = 5.04, p < 0.05). V. natans had the highest BCF for As, Fe and Mn (F > 4.21, p < 0.05). C. demersum had the highest BCF for Ni, P. macckianus and M. spicatum the intermediate, V. natans the lowest (F = 15.15, p < 0.001).
The TF between the sediment and the water was calculated for Ba, Co, Cu, Fe, Mn, Ni, Pb and Sr since the concentrations of As, Cr, Mo and Zn in the water were not detectable in the most sampling sites. There were contrasting values of TF for different elements ranging from the magnitude of 1 x 10⁻⁶ to 1 x 10⁻³ (if excluding the zeros), but there were no significant differences among the three sub-lakes (F < 2.92, p > 0.05).
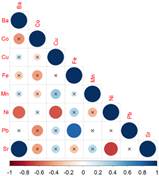
Figure 3. The correlation between the trace elements and heavy metal concentrations of water in the Lake Liangzihu, China. The larger circle means the stronger correlation, and the cross means no significance at the level of 0.05.
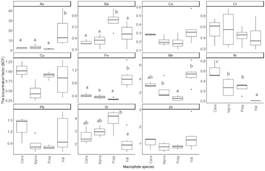
Figure 4. The bioconcentration factor (BCF) between the macrophytes and the sediment for the trace elements and heavy metals in Lake Liangzihu, China. Cera, Myrio, Pota and Val refer to Ceratophyllum demersum, Myriophyllum spicatum, Potamogeton macckianus and Vallisneria natans, respectively. Different letters indicate the significant difference between the plant species.
DISCUSSION
Our study focused on the dissolved trace elements and heavy metals in fourteen sites of a largehallow Lake Liangzihu. At a whole lake level, the lake was at the low risk of heavy metal contamination based on the ecological risk index (RI < 100) (Jiang et al. 2017). However, by comparison with the ten lakes of mid-low reaches of Yangzte River (Liu and Li. 2011), Lake Liangzihu belonged to the cluster of the moderate polluted lakes. Lake Taihu was evaluated as moderate to high Hg contamination based on Igeo of the sediment (Chen et al. 2013), and water and sediment small ponds around Lake Dianchi were also assessed as Pb pollution (Wang et al. 2014). In this study, the Igeo score of As, Pb and Zn in sediment were of relatively high risk (Loska et al. 1997) and in the water only Ni was close to the safety level (WHO. 2004).
Three metals (Ba and Sr in the sediment and Ni the water) differed at the sub-lake level. The uptake of macrophytes communities could be one of the reasons for the changes of heavy metals in lakes (Rai. 2008). Take Ba as an example, Ba was higher in DH than in QH in sediment but not in water. Meanwhile, BCF of Ba was < 1 but was highest in P. macckianus, which was the dominant species in QH. As the bottom cover species (Li and Zhong. 1992), it has very developed root and stolon system and likely to produce a strong plant uptake of Ba from the sediment. Another metal Ni had higher concentrations in ZH than other two sub-lakes, which was probably due to the dominant Vallisneria natans in ZH with lowest BCF of Ni. The different economical modes (fishery or tourism) of the three sub-lakes could also contribute to the dynamics of the trace element and heavy metals (Liu and Li. 2011); e.g., large amounts of fertilizers that contained these elements might be added into the cultivation enclosure and remained in the sediment. At the sampling site level, there was strong variation of trace elements and heavy metals in sediment and water. For example, 9.19-36.39 μg g-1 As in the sediment and 0-7.4 μg L-1 Pb in the water indicated an important role of small-scale spatial pattern within the investigated fourteen sites.
Apart from As and other two metals, most of trace elements and heavy metals in sediment were positively correlated, which suggested that most of these elements have the same or similar source. However, the elements in water were not so correlated, indicating a more dynamic process of these elements in the water column. In addition, As concentrations high in sediment but below detection in the water indicated that there were different mechanisms in regulating the dynamics of As between the two media, and the high As content in macrophytes were probably from the sediment (Zheng et al. 2003). There were also significant differences of BCF among the four macrophytes species. Xing et al. (2013) has found that C. demersum had very high BCF for Co, Cr and Fe, and V. natans was a hyperaccumulator for Pb in mid-low reaches of Yangtze River. Wang et al. (2014) also revealed a high Cr, Fe and Ni accumulation in C. demersum in ponds around Lake Dianchi. Our study not only supported that C. demersum had strong ability of heavy metal bioconcentration (e.g. Ni, Cr, Cu and Pb) but also discovered a potential hyperaccumulator V. natans as in Xing et al. (2013).
In conclusion, our results supported the importance of small-scale spatial patterns for the distribution of trace elements and heavy metals in large shallow lakes. In addition, the local species C. demersum and V. natans could be a good candidate species for removing heavy metals if the concentrations of Ni, As and Pb increased in lake in future.
REFERENCES
- Arinaitwe K, Rose NL, Muir DCG, Kiremire BT, Baliirwa JS and Teixeira C (2016) Historical deposition of persistent organic pollutants in Lake Victoria and two alpine equatorial lakes from East Africa: Insights into atmospheric deposition from sedimentation profiles. Chemosphere 144:1815–1822
- Cao Y, Liu H, Sun J, Liu Y, Jiang HS, Wang W and Li We (2019) Responses of propagule germination and sexual reproduction of submerged macrophytes exposed to cadmium. Chemosphere 219:436–443
- Chen CX, Zheng BH, Jiang X, Zhao Z, Zhan YZ, Yi FJ and Ren JY (2013) Spatial distribution and pollution assessment of mercury in sediments of Lake Taihu, China. J. Environ. Sci. 25:316–325
- Chinese State Environment Protection Bureau Chinese surface water quality standards (CSWQS, GB3838–2002)
- Demirak A, Yilmaz F, Tuna AL, Ozdemir N (2006) Heavy metals in water, sediment and tissues of Leuciscus cephalus from a stream in southwestern Turkey. Chemosphere 63:1451–1458
- Guo BX, Liu YQ, Zhang F,Hou JZ,Zhang HB and Li CL (2018) Heavy metals in the surface sediments of lakes on the Tibetan Plateau, China. Environ. Sci. Pollut. Res. 25:3695–3707
- Hakanson L (1980) An ecological risk index for aquatic pollution control. A sedimentological approach. Water Res. 14:975–1001
- Huang XF, Chen WM, Cai QM (1999) Survey, observation and analysis of lake ecology - standard methods for observation and analysis in Chinese Ecosystem Research Network, Series V.
- Jiang XL, Xiong ZQ, Liu H, Liu GH and Liu WZ (2017) Distribution, source identification, and ecological risk assessment of heavy metals in wetland soils of a river–reservoir system. Environ. Sci. Pollut. Res. 24:436–444
- Li W and Zhong Y (1992) Theories and methods of aquatic vegetation research. Wuhan: Huazhong Normal University Press.
- Liu H and Li W (2011) Dissolved trace elements and heavy metals from the shallow lakes in the middle and lower reaches of the Yangtze River region, China. Environ. Earth Sci. 62:1503–1511
- Liu W, Zhang Q, Liu G (2010) Lake eutrophication associated with geographic location, lake morphology and climate in China. Hydrobiologia 644:289–299
- Loska K, Cebula J, Pelczar J, Wiechula D and Kwapulinski J (1997) Use of enrichment, and contamination factors together with geoaccumulation indexes to evaluate the content of Cd, Cu, and Ni in the Rybnik water reservoir in Poland. Water Air Soil Pollut. 93:347–365
- Muller G (1969) Index of geoaccumulation in sediments of the Rhine River. Geo.Journal 2:108–118
- Rai PK (2008) Phytoremediation of Hg Ans Cd from Industrial Effluents Using an Aquatic Free Floating Macrophyte Azolla pinnata. Int. J. Phytoremediation 10:430–439
- Wagner GJ (1992) Accumulation of cadmium in crop plants and its consequences to human health. Adv. Agron. 51:173–212.
- Wang SM and Dou HS (1998) Chinese lake catalogue. Beijing
- Wang W, Ndungu AW, Li Z, Wang J (2017) Microplastics pollution in inland freshwaters of China: a case study in urban surface waters of Wuhan, China. Sci. Total Environ. 575:1369–1374
- Wang YQ, Yang LY, Kong LH, Liu LH, Wang LF and Zhu JR (2015) Spatial distribution, ecological risk assessment and source identification for heavy metals in surface sediments from Dongping Lake, Shandong, East China. CATENA 125:200–205.
- Wang Z, Yao L, Liu G, Liu W (2014) Heavy metals in water, sediments and submerged macrophytes in ponds around the Dianchi Lake, China. Ecotoxicol. Environ. Saf. 107:200–206.
- WHO (2004) Guidelines for drinking-water quality Vol 1 - Recommendations, 3rd edn. World Health Organization, Geneva
- Xing W, Wu HP, Hao BB, Huang WH and Liu GH (2013) Bioaccumulation of heavy metals by submerged macrophytes: Looking for hyperaccumulators in eutrophic Lakes. Environ. Sci. Technol. 47:4695–4703
- Zhang J, Li ZH, Chen J, Wang M, Tao R and Liu D (2014) Assessment of heavy metal contamination status in sediments and identification of pollution source in Daye Lake, Central China. Environmental earth sciences. 72:1279–1288.
- Zheng J, Hintelmann H, Dimock B, Dzurko MS (2003) Speciation of arsenic in water, sediment, and plants of the Moira watershed, Canada, using HPLC coupled to high resolution ICP-MS. Anal. Bioanal. Chem. 377:14–24
- Zhou J, Cao Y, Liu X (2020) Bladder entrance of microplastic likely induces toxic effects in carnivorous macrophyte Utricularia aurea Lour. Environ. Sci. Pollut. Res. 27: 32124–32131
APPENDIX
Table S1. Geography location of the 14 investigated sites in Lake Liangzihu, China.
|
Sub-lakes
|
Code
|
Site ID
|
Longitude(E)
|
Latitude (N)
|
|
Zhonghu
|
ZH
|
1
|
114o 27.15'
|
30o 09.79'
|
|
Zhonghu
|
ZH
|
2
|
114o 27.15'
|
30o 10.90'
|
|
Zhonghu
|
ZH
|
3
|
114o 27.15'
|
30o 11.98'
|
|
Zhonghu
|
ZH
|
4
|
114o 27.15'
|
30o 14.13'
|
|
Qianjiangdahu
|
QH
|
5
|
114o 28.40'
|
30o 14.13'
|
|
Qianjiangdahu
|
QH
|
6
|
114o 29.65'
|
30o 14.13'
|
|
Qianjiangdahu
|
QH
|
7
|
114o 32.18'
|
30o 15.21'
|
|
Qianjiangdahu
|
QH
|
8
|
114o 33.43'
|
30o 15.21'
|
|
Qianjiangdahu
|
QH
|
9
|
114o 34.67'
|
30o 16.29'
|
|
Donghu
|
DH
|
10
|
114o 34.67'
|
30o 15.21'
|
|
Donghu
|
DH
|
11
|
114o 34.67'
|
30o 14.13'
|
|
Donghu
|
DH
|
12
|
114o 35.92'
|
30o 13.06'
|
|
Donghu
|
DH
|
13
|
114o 34.67'
|
30o 11.98'
|
|
Donghu
|
DH
|
14
|
114o 35.92'
|
30o 10.90'
|
Table S2. The water physical-chemistry in the fourteen sites of three sub-lakes in the Lake Liangzihu.
Site ID |
Sub-lakes |
Temperature
(oC) |
C
(us cm-1) |
pH |
ORP
(mV) |
NH4-N
(mg L-1) |
Turbidity
(NTU) |
COD
(mg L-1) |
TN
(mg L-1) |
TP
(mg L-1) |
1 |
ZH |
30.63 |
125 |
9.16 |
23.4 |
0.03 |
1.3 |
3.64 |
0.43 |
0.018 |
2 |
ZH |
30.61 |
128 |
9.28 |
37.2 |
0.04 |
0.8 |
4.22 |
0.64 |
0.024 |
3 |
ZH |
30.66 |
128 |
9.11 |
32.8 |
0.06 |
0.9 |
3.74 |
0.51 |
0.016 |
4 |
ZH |
30.83 |
127 |
9.36 |
44.1 |
0.08 |
3.4 |
4.81 |
0.82 |
0.025 |
5 |
QH |
31.37 |
137 |
9.80 |
25.4 |
0.08 |
0.2 |
4.62 |
0.46 |
0.021 |
6 |
QH |
31.15 |
141 |
9.62 |
19.4 |
0.09 |
0.1 |
3.67 |
0.41 |
0.023 |
7 |
QH |
31.49 |
189 |
9.69 |
21.4 |
0.12 |
0.2 |
2.61 |
0.97 |
0.024 |
8 |
QH |
31.17 |
275 |
8.88 |
41.5 |
0.13 |
16.2 |
3.20 |
1.64 |
0.029 |
9 |
QH |
28.42 |
290 |
8.03 |
42.1 |
0.12 |
81.2 |
2.38 |
1.21 |
0.094 |
10 |
DH |
28.94 |
281 |
8.84 |
23.6 |
0.12 |
6.0 |
3.13 |
0.50 |
0.039 |
11 |
DH |
28.53 |
255 |
9.57 |
26.3 |
0.06 |
16.8 |
4.08 |
1.18 |
0.058 |
12 |
DH |
29.72 |
200 |
9.52 |
29.4 |
0.13 |
14.6 |
4.08 |
1.34 |
0.061 |
13 |
DH |
28.72 |
206 |
9.32 |
37.9 |
0.12 |
17.0 |
6.11 |
1.13 |
0.077 |
14 |
DH |
28.59 |
266 |
7.34 |
92.7 |
0.11 |
2.2 |
5.19 |
0.81 |
0.035 |
Table S3. Trace elements and heavy metal content in macrophytes in the Lake Liangzihu, China.
|
Species
|
Site ID
|
Ba
|
As
|
Co
|
Cr
|
Cu
|
Fe
|
Mn
|
Mo
|
Ni
|
Pb
|
Sr
|
Zn
|
|
Vallisneria sp
|
1
|
320.5
|
386.9
|
11.6
|
26.27
|
39.77
|
42690
|
1943
|
nda
|
nd
|
49.31
|
260.1
|
446.2
|
|
Vallisneria sp
|
4
|
288.4
|
189.5
|
9.17
|
41.4
|
77.58
|
34330
|
6091
|
3.52
|
nd
|
36.15
|
205.6
|
264.6
|
|
Vallisneria sp
|
8
|
238.8
|
525.1
|
4.6
|
27.18
|
44.04
|
30570
|
3517
|
11.58
|
nd
|
33.73
|
167.9
|
149.2
|
|
Vallisneria sp
|
9
|
218.1
|
137.4
|
9.23
|
16.21
|
25.79
|
25730
|
2851
|
0.45
|
nd
|
28.9
|
223.3
|
129.6
|
|
Vallisneria sp
|
10
|
354.6
|
112.5
|
7.17
|
19.88
|
84.47
|
38280
|
5436
|
1.78
|
nd
|
52.96
|
239.5
|
270.8
|
|
Vallisneria sp
|
14
|
334.9
|
227.5
|
6.78
|
20.45
|
25.31
|
21790
|
4920
|
1.45
|
nd
|
42.57
|
247.5
|
167.4
|
|
P. macckianus
|
5
|
222.2
|
17.49
|
6.92
|
28.8
|
32.47
|
9309
|
650.4
|
2.34
|
6.64
|
26.87
|
275.9
|
114.8
|
|
P. macckianus
|
6
|
360.6
|
30.99
|
4.43
|
28.76
|
49.7
|
12130
|
1429
|
2.09
|
8.21
|
31.62
|
541
|
130.1
|
|
P. macckianus
|
7
|
333.4
|
24.92
|
2.75
|
15.08
|
49.89
|
8653
|
864.8
|
3.27
|
2.61
|
28.42
|
499.6
|
164.2
|
|
P. macckianus
|
8
|
343.5
|
17.76
|
4.12
|
31.75
|
58.85
|
9848
|
1191
|
2.56
|
9.93
|
30.74
|
492.8
|
134.8
|
|
M. spicatum
|
10
|
288.4
|
111.7
|
4.57
|
24.04
|
51.82
|
15890
|
1805
|
8.26
|
3.55
|
35.91
|
385.7
|
124.9
|
|
M. spicatum
|
13
|
287.9
|
71.36
|
4.49
|
20.28
|
18.31
|
9874
|
1605
|
0.51
|
4.57
|
31.21
|
357.7
|
91.9
|
|
M. spicatum
|
14
|
302.3
|
17.96
|
5.39
|
51.39
|
21.96
|
11520
|
1840
|
3.22
|
14.82
|
32.14
|
300.7
|
160.8
|
|
M. spicatum
|
14
|
365
|
24.74
|
7.8
|
60.12
|
31.78
|
12340
|
4745
|
7.54
|
16.39
|
33.98
|
272
|
180.6
|
|
C. demersum
|
10
|
249.8
|
38.74
|
6.67
|
20.46
|
82.76
|
12970
|
3201
|
4.13
|
18.21
|
45.21
|
293.7
|
250.8
|
|
C. demersum
|
10
|
279.6
|
43.99
|
7.42
|
59.88
|
65.92
|
13890
|
4119
|
1.98
|
29.99
|
47.32
|
254.4
|
237.8
|
|
C. demersum
|
11
|
352.5
|
30.34
|
8.38
|
50.53
|
63.44
|
17380
|
3031
|
0.72
|
21.97
|
38.95
|
390.2
|
159.3
|
Bn is the background concentrations.
a ‘nd’ means that the concentration is lower than the detection level.
Table S4. The bioconcentration factor of trace elements and heavy metal content in macrophytes in the Lake Liangzihu,China.
|
Species
|
Site ID
|
Ba
|
As
|
Co
|
Cr
|
Cu
|
Fe
|
Mn
|
Mo
|
Ni
|
Pb
|
Sr
|
Zn
|
|
Vallisneria sp
|
1
|
0.55
|
42.10
|
0.58
|
0.58
|
0.98
|
1.51
|
5.03
|
0.00
|
0.00
|
1.72
|
3.47
|
2.88
|
|
Vallisneria sp
|
4
|
0.48
|
10.23
|
0.34
|
0.79
|
1.17
|
0.94
|
6.71
|
nc a
|
0.00
|
0.79
|
1.88
|
1.43
|
|
Vallisneria sp
|
8
|
0.39
|
31.33
|
0.18
|
0.37
|
0.67
|
0.87
|
4.01
|
nc
|
0.00
|
0.83
|
1.34
|
0.84
|
|
Vallisneria sp
|
9
|
0.30
|
6.52
|
0.33
|
0.19
|
0.32
|
0.70
|
2.43
|
nc
|
0.00
|
0.67
|
1.45
|
0.61
|
|
Vallisneria sp
|
10
|
0.50
|
7.06
|
0.28
|
0.25
|
1.29
|
1.07
|
4.71
|
0.66
|
0.00
|
1.71
|
1.92
|
1.40
|
|
Vallisneria sp
|
14
|
0.39
|
14.78
|
0.25
|
0.32
|
0.39
|
0.65
|
4.61
|
1.49
|
0.00
|
1.03
|
2.27
|
1.00
|
|
P. macckianus
|
5
|
0.44
|
1.02
|
0.30
|
0.61
|
0.75
|
0.28
|
0.88
|
nc
|
0.29
|
0.87
|
2.58
|
0.85
|
|
P. macckianus
|
6
|
0.66
|
0.96
|
0.19
|
0.46
|
0.99
|
0.35
|
1.58
|
nc
|
0.33
|
0.81
|
4.53
|
0.64
|
|
P. macckianus
|
7
|
0.56
|
1.42
|
0.11
|
0.22
|
0.92
|
0.24
|
0.80
|
nc
|
0.09
|
0.76
|
4.39
|
0.94
|
|
P. macckianus
|
8
|
0.56
|
1.06
|
0.16
|
0.44
|
0.89
|
0.28
|
1.36
|
nc
|
0.32
|
0.76
|
3.93
|
0.76
|
|
M. spicatum
|
10
|
0.40
|
7.01
|
0.18
|
0.30
|
0.79
|
0.44
|
1.57
|
3.07
|
0.10
|
1.16
|
3.10
|
0.64
|
|
M. spicatum
|
13
|
0.30
|
3.10
|
0.15
|
0.22
|
0.24
|
0.28
|
1.58
|
1.09
|
0.11
|
0.68
|
3.42
|
0.48
|
|
M. spicatum
|
14
|
0.36
|
1.17
|
0.20
|
0.79
|
0.34
|
0.34
|
1.72
|
3.32
|
0.42
|
0.78
|
2.76
|
0.96
|
|
M. spicatum
|
14
|
0.43
|
1.61
|
0.28
|
0.93
|
0.49
|
0.37
|
4.45
|
7.77
|
0.46
|
0.82
|
2.50
|
1.07
|
|
C. demersum
|
10
|
0.35
|
2.43
|
0.26
|
0.25
|
1.26
|
0.36
|
2.78
|
1.54
|
0.50
|
1.46
|
2.36
|
1.29
|
|
C. demersum
|
10
|
0.39
|
2.76
|
0.29
|
0.74
|
1.01
|
0.39
|
3.57
|
0.74
|
0.82
|
1.53
|
2.04
|
1.23
|
|
C. demersum
|
11
|
0.35
|
0.83
|
0.28
|
0.61
|
0.82
|
0.48
|
2.98
|
1.13
|
0.51
|
0.90
|
3.42
|
0.59
|
a nc means ‘not calculated’.
|