A QUICK COUNTING METHOD FOR WINTER WHEAT AT THE SEEDLING STAGE IN FIELDS BASED ON AN IMPROVED YOLOV4 MODEL
H. Ma 1,2, W. Zhao1, J. Ji 1,2*, X. Jin1,2, Y. Shi1, F. Zheng1 and N. Li1
1College of Agricultural Equipment Engineering, Henan university of science and technology, Luoyang 471003, China
2Collaborative Innovation Center of Machinery Equipment Advanced Manufacturing of Henan Province, Luoyang 471003, China
*Corresponding author’s email: jjt0907@163.com
ABSTRACT
To realize the fast and accurate counting of winter wheat at the seedling stage in fields, we propose a recognition method based on an improved YOLOv4 model. Firstly, we employed a simplified MobileNetv3 neural network instead of the standard CSPDarknet53 network structure. Besides, we added an adaptive image scaling layer in front of the MobileNetv3 network. Finally, we utilized the coyote optimization algorithm (COA) to optimize the learning rate and convolution kernel size. Results showed that the average precision (AP) values of the improved network model for 2-leaf and 3-leaf winter wheat were 96.46% and 93.87%, respectively. The mean average accuracy (mAP) was 95.15% and the average recognition speed was 0.07 s. These indicators were the best, compared with the YOLOv4, YOLOv3, and Faster-RCNN models. Also, the mAP was 12.28% higher than the standard YOLOv4model, and the average recognition speed was 1.49 times faster. Therefore, this method can achieve the fast and accurate counting of winter wheat during the seedling stage in the field.
Keywords: Winter wheat recognition at the seedling stage; YOLOv4; MobileNetv3; Adaptive image scaling; Coyote optimization algorithm
https://doi.org/10.36899/JAPS.2022.6.0575
Published first online June 11, 2022
INTRODUCTION
The yield of winter wheat, one of the primary food crops in China, is closely related to national food security. The seedling stage, which is the starting point of wheat cultivation, marks the beginning of plant population regulation. Appropriate planting density improves the performance of winter wheat population regulation, allows the plants to make full use of soil fertility and light energy, and achieves the purpose of increasing yields (Li Haikang et al., 2019; Jia Lina et al., 2019; Wang Zhijie et al., 2001). To determine the optimal planting density of winter wheat, it is essential to maintain accurate and efficient statistics of winter wheat plant quantity at the seedling stage (Olsen J et al., 2006; Liu Zhe et al., 2020). Besides, in the process of winter wheat breeding, the number of wheat plants at the seedling stage is usually used as an important index to predict yield, test seed quality, and calculate seedling emergence rate (Liu Xinyi et al., 2020; Wang Weiqing et al., 2015; Liu Zhi et al., 2019). Of these, the emergence rate is an important standard that measures seed vigor, soil environment, sowing technology, and fertilization method (Wang Ruihua et al., 2019). However, at present, establishing the number of winter wheat seedlings is still mainly dependent on manual counting. This has several disadvantages, such as the waste of human resources, low calculation efficiency and high cost. Therefore, a fast and accurate counting method is urgently required. In recent years, with the growth in computer vision technology, new approaches have been devised for the counting of winter wheat seedlings.
Until now, traditional computer vision has led to some progress in the area of crop identification. In the recognition of wheat, Liu Tao et al. (2014) preliminarily extracted wheat ears based on color and texture features, then used the Harris corner detection algorithm to identify wheat ears and adhesion regions. Liu Zhe et al. (2019) recognized wheat ears in the spatial region based on color feature clustering by improving the K-means clustering algorithm. Besides, Ji Kai (2019) firstly segmented the wheat rhizome based on structural characteristics, then counted the extreme points of the waveforms of R and S channels in the wheat rhizome image, and finally indirectly realized the recognition of the wheat rhizome in the overlapping region. Furthermore, there has also been extensive research on the identification of corn, rice, and other food crops. Jia Honglei et al. (2015) extracted the contour feature of corn straw sections based on the contour extraction method, then used this feature to identify corn plant straw. Reza Mdnasim et al. (2017) employed UAVs to obtain RGB images of rice after transplanting, then combined the data with morphological operations and connected region boundary extraction technology to automatically identify field rice, with a recognition accuracy of about 91%. Although the above research projects have been initially automated in crop recognition, they were mainly based on morphological features such as color, texture, and structure of the extracted crops, and the feature extractor had to be designed manually. Therefore, the systems have a low degree of automation and are easily affected by the field environment and the robustness of feature extractors, thus leading to deficiencies in the accuracy and reliability of real-time winter wheat recognition at the seedling stage.
In recent years, with the continuous innovation of deep convolution neural networks (Li Tong et al., 2020; Huang Jian et al., 2020; Pazoki, A et al., 2014), a large number of target detection algorithms with excellent performance have emerged. These models, which can be roughly divided into two categories, are gradually being implemented more frequently in the field of crop recognition. The first type is the two-stage target detection algorithm, which firstly generates multiple target candidate boxes, then classifies and regresses the position of each candidate box. Algorithms of this type include RCNN (Ross Girshick et al., 2014; Wang Ruihua et al., 2021), Fast-RCNN (Ross Girshick, 2015; Ye Yimin et al., 2018), Faster-RCNN (Ren Shaoqing et al., 2015; Sun Zheng et al., 2018) and so on. Song Zhengzheng et al. (2015) and Yan Jianwei et al. (2019) used the two-stage target detection based on Faster R-CNN to identify kiwifruit and Roxburgh rose, respectively. The average recognition accuracy was 87.61% for the kiwifruit and 92.01%for the Roxburgh rose. The other approach is the single-stage target detection algorithm, which is based on the idea of regression. It does not need to generate a target candidate box, and the process of feature extraction, target classification, and position regression are completed directly in a convolutional neural network (CNN). Therefore, this type of algorithm usually has a faster recognition speed than the two-stage target detection algorithm. Examples of this type of algorithm include SSD (Liu Wei et al., 2016; Peng Hongxing et al., 2018), EfficientDet (Tan Mingxing et al., 2019), the YOLO series (Joseph Redmon et al., 2016, 2017, 2018; Bochkovskiy Alexey et al., 2020), etc. Liu Xiaogang et al. (2018) applied the improved YOLOv3 network to identify strawberries in complex environments. The accuracy was about 95% and the average detection time was 34.99 ms. This research provides a reference and a feasible basis for the application of deep convolutional neural networks in the field of crop recognition. At the same time, it has higher feature expression ability and recognition speed than traditional computer vision technology.
To realize the rapid and accurate counting of winter wheat at the seedling stage in a field environment, we combined the advantages of the YOLO and MobileNet series networks, improved the YOLOv4 network model, and optimized the learning rate and convolution core size of the improved network model based on the coyote optimization algorithm. Ultimately, the recognition accuracy and speed of the improved network model for 2-leaf and 3-leaf winter wheat in the field were much higher than other comparative networks, demonstrating that this method can effectively replace manual counting.
MATERIALS AND METHODS
Experimental Data
Data Set Acquisition: Experimental data were collected from winter wheat (Baofeng 540) seedlings at the 2- leaf stage and 3-leaf stage (Liu Tao et al.,2018). The collection site was a winter wheat field (112 ° N, 34 ° E) in the suburbs of Luoyang City, Henan Province, China, From October 25 to November 11, 2020, we used a Canon EOS80D camera to capture the images. Images were taken under different conditions, including sunny and cloudy days, and in the morning, afternoon, and evening. Ultimately, we collected a total of 327 original images with different densities, including 217 in the 2-leaf stage and 110 in the 3-leaf stage.
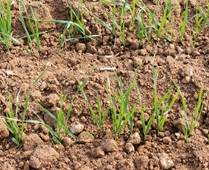
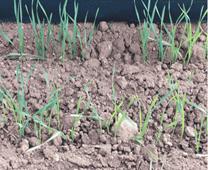
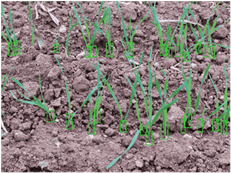
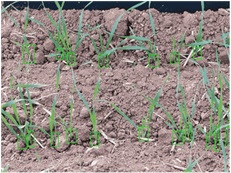
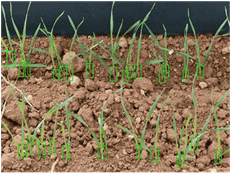
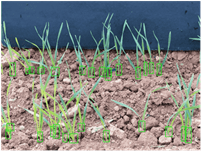
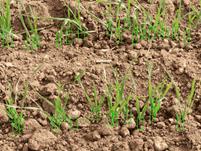
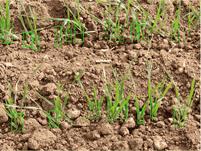
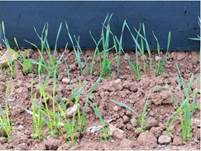
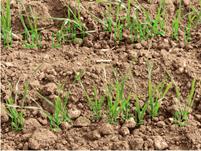
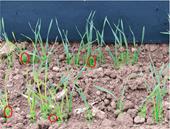
During the process of image acquisition, considering the structure and community characteristics of winter wheat in the seedling stage, we discovered that cross shielding between adjacent leaves of winter wheat was serious. To facilitate identification, we only used the improved network model for target recognition of the rhizome of winter wheat seedlings. The rhizome of winter wheat seedlings refers to the part of the root within 3cm of the surface. After many attempts, we found that collecting only two rows of winter wheat images not only sufficiently highlights rhizome characteristics, but also ensures images collection efficiency. Shooting requirements: the lens was perpendicular to the ground 40 cm~ 50 cm, and the angle was 30°~50° to the horizontal plane. Besides, to prevent the third row of winter wheat rhizomes from appearing in the image and causing interference, we utilized a background plate when necessary to assist shooting. The shooting effect is presented in Figure 1.
|
(a)
|
(b)
|
Figure 1. original image with or without background plate: (a) No background plate; (b) With background plate.
Data Set Preparation: To enrich the data set, enhance the generalization ability of the network model, and avoid overfitting of the model, we used MATLAB2017b (Math Works, Natick, Massachusetts, USA) to adjust the brightness, contrast, and color levels of the original images. At the same time, considering that data amplification might seriously affect image quality, we randomly amplified each image using one of the above methods. Finally, we obtained 593 images in the data set, including 390 in the 2-leaf stage and 203 images of winter wheat in the 3-leaf stage.
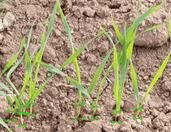
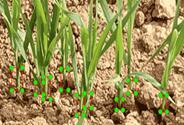
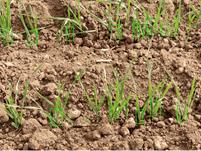
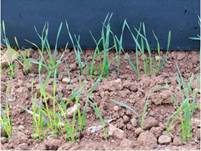
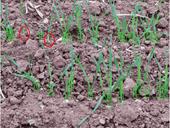
We used the LabelImg toolbox to label the samples of the data set. Because the identification object of the improved network model was the rhizome of winter wheat seedlings, we only labeled the rhizomes of the winter wheat seedlings. Figure 2 displays illustrations of local sample labeling. After we completed the labeling step, we randomly divided the data set into a training set and a test set according to the ratio of 70% and 30%. The training set contained 5,722 border labeled samples, including 3,763 samples of 2-leaf stage winter wheat and 1,959 samples of 3-leaf stage winter wheat.
|
(a)
|
(b)
|
Figure 2. Marking of wheat rhizome samples at local seedling stage: (a) 2-leaf stage wheat; (b) 3-leaf stage wheat.
Improved YOLOv4 Seedling Winter Wheat Recognition Network and Training
YOLOv4 Network Model: The YOLO network is a single-stage target detection algorithm based on regression, which firstly divides the input image into S × S grids. If the center point of the target falls within the grid, the grid is responsible for predicting the boundary box position information and category information, thus greatly improving detection speed. However, this approach can lead to some problems, such as positioning error and insufficient detection of small targets. Aleey developed YOLOv4 through optimization of each part of YOLOv3 by integrating a large number of research achievements in the field of deep learning. Certain network structures were introduced, such as CSPNet (cross stage partial network), SPPNet (spatial pyramid pooling networks), and PANet (path aggregation network) to further improve the feature expression ability and computational efficiency of the network (Wang Chienyao et al.,2020; He Kaiming et al.,2014; Li Shu et al.,2018). Furthermore, the original IoU (intersection over union) loss function was replaced by the CIoU (complete-IoU) function to increase scale information such as the coincidence degree, center distance, and aspect ratio of the frame. As a result, the regression speed was faster and the accuracy of the prediction frame was higher. Overall, YOLOv4 is faster and more accurate than YOLOv3, and it has superior ability in detecting small targets. Therefore, considering the characteristics of small winter wheat rhizomes at the seedling stage and the requirements for recognition speed and accuracy, we used YOLOv4 as the basic network.
Improvement of Network Model Structure: To realize the rapid and accurate identification of winter wheat at the seeding stage, we replaced the original CSPDarknet53 feature extraction network with the simplified MobileNetv3 network, based on the YOLOv4 network structure. The MobileNet (Howard Andrew G et al.,2017) network is a kind of lightweight deep neural network based on mobile terminals. Its core concept is to use depthwise separable convolutions instead of standard convolutions, which reduces the number of parameters and computations by increasing the number of network layers. Its working principle can be further understood in conjunction with Figure 3 and Equation 1. Besides, MobileNetv3 (Howard Andrew G et al.,2019)employs hard-swish (h-swish) instead of the swish nonlinear activation function and uses MobileNetv2 as a basis (Mark Sandler et al.,2018), to improve counting speed while maintaining accuracy, it also introduces squeeze and excitation modules (SE) to determine the relationship between modeling channels, thus improving the feature expression ability of the model. At the same time, we utilized a 5×5DW (depthwise) convolution to replace part of the 3×3DW convolution of the original network to increase the receptive field and further improve model accuracy. The basic network structure is shown in Figure 3.

Figure 3: Basic network structure diagram of MobileNetv3.
The ratio of the number of parameters between depthwise separable convolution and traditional convolution is:
 (1) (1)
Here, DFis the image input size, DK represents convolution kernel size, M signifies the input channel, and N is the output channel.We can see from Equation 1 that by using the depthwise separable convolution layer instead of the standard convolution layer in the convolution network model, the number of calculations required for the convolution operation of the same image is greatly reduced.
Through Figures 1 and 2, we can observe that the rhizome of winter wheat at the seedling stage was relatively small. Additionally, affected by topography, sowing depth, and shooting method, the length of the winter wheat rhizome in the images varies. When we used a fixed image size to calculate convolution and other operations, it generated larger errors. Therefore, in this paper, we added an adaptive image scaling layer in front of the MobileNetv3 network, and the specific structure is presented in Figure 4. Firstly, we applied the feature pyramid network (FPN; Lin Tsung-Yi et al., 2017) to scale the input image to four different scales, then calculated the score values of the four different scaling ratios. Finally, we selected the most suitable scaling ratio by employing specific search algorithms, so that the scaling size of the image met the optimal recognition and prediction performance levels. Besides, we obtained the score value by using the following method. In the training process, the trainer automatically calculated the recognition rate of the detection results for different frame sizes, and each training generated the training accuracy. Next, we divided the training accuracy by 100 to obtain a score. Higher levels of accuracy resulted in higher scores.
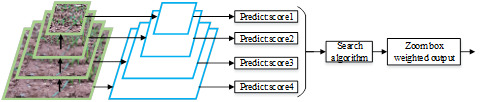
Figure 4: Adaptive scaling network framework
The steps of the search algorithm were as follows:
Determine the maximum value of the four scores. If the value of Scorej is close to 1, the output is based on the current zoom size and W=Wj. If the maximum score of the image scaling ratio is quite different from 1, and the maximum value of Scorejis close to the second maximum Scorei value, then the image zoom size output is:
 (2) (2)
Where W is the most suitable scaling size, while Wiand Wj represent the corresponding image scaling ratios of the current feature map, respectively.
Figure 5 displays the overall improved network model. Using YOLOv4 as a foundation, we firstly substituted the original CSPDarknet53 feature extraction network with the simplified MobileNetv3 network structure, then added an adaptive image zoom layer at the front end. Figure 5(a)~(f) shows the partial visualization process of winter wheat identification at the seedling stage. From Figure 5(a)~(e), we can see that with the deepening of the network layers, the receptive field became smaller and the local features more prominent, thus realizing the extraction of image feature information from the global to the local level. Moreover, with the enhancement of feature map granularity, the high dimensional features became clearer, indicating that the network can effectively extract the rhizomes features of winter wheat seedlings. Besides, Figure 5(f) indicates that the PANet network structure fused the high-level features of low-resolution and high-semantic information with the low-level features of high-resolution and low-semantic information. Therefore, the rhizome features of winter wheat in the seedling stage were obvious at this time. Finally, the improved network generated three characteristic maps with different scales. Among them, we used the 52 × 52 characteristic map to detect the small size winter wheat rhizome, the 26 × 26 map corresponded to medium-sized winter wheat rhizome, and the 13 × 13 map was the largest receptive field used to detect the rhizome of large size winter wheat.

Figure 5. Improved network structure based on YOLOv4.
Coyote Optimization Algorithm: In this experiment, to obtain the optimal network model parameters, we used the coyote optimization algorithm (COA) proposed by Pierezan Juliano et al. (2018). This algorithm simulates the birth, growth, death, and migration of a coyote population from two aspects of social organization characteristics and environmental adaptability. It not only has high search efficiency but also avoids the problem of local optimization. The main optimization parameters in this experiment were learning rate and convolution kernel size. An appropriate learning rate locates the best network optimization model in the shortest model training time. Besides, a suitable convolution kernel size ensures a smaller amount of computation and also increases the receptive field. The specific parameter optimization process is shown in Figure 6. Firstly, we completed the initialization of the coyote population (learning rate and convolution kernel size) and evaluated the social adaptability of each coyote. Secondly, we determined the head coyote and the cultural trend of the population and found the current optimal coyote. Next, we simulated the birth and death rates of coyotes according to heredity and variation, to realize the renewal characteristics of the coyote group. Finally, we carried out calculations regarding the migration of the whole coyote population and the age renewal of all the coyotes. When the optimal coyote individual achieved the predetermined conditions, we stop the whole cycle.
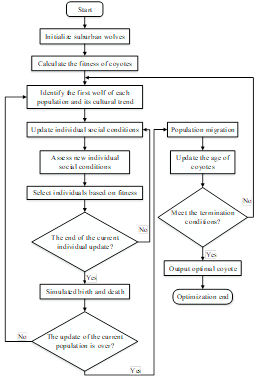
Figure 6. Coyote optimization algorithm flow chart.
Training of the Improved Network Model: 1) Test platform. All the training and testing in this paper were performed on the same compute, running the Windows_10 (64-bit) operation system, with an Intel Core i7-9750 processor, 2.6GHz main frequency, 32GB running memory, 1T solid-state disk, and an RTX2060 GPU.
2) Model training. In this experiment, we used the images of 2-leaf stage and 3-leaf stage winter wheat and expanded the training set for model training. The initialization parameters of the network model were set to 0. 01 initial learning rate, 0. 9 momentum parameters, 10000 iterations, and one batch every 50 iterations. Thus, there were 200 batches in the whole training process.
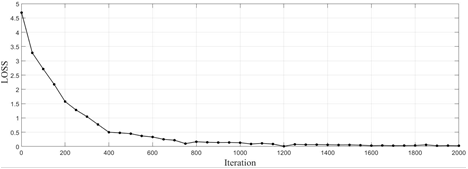
Figure 7 displays the process, and Figure 7(a) presents the change process of loss throughout the whole training stage with the deepening of iteration times. The overall curve showed a downward trend and the loss function eventually maintained a position of 0.02. Derived from Figure 7(a), Figure (b) illustrates the iteration-loss curve after 2000 iterations. These two figures show that when iterating for 200 and 400 times, the descending range is greatly reduced, while when iterating for 800 times, the descending range tends to be stable, and only slightly oscillates. This indicates that the selected learning rate is suitable for the network model.

(a)
(b)
Figure 7: Loss iterative curve: (a) Loss curve in the whole training stage; (b) 2000 iterations of LOSS curve.
3) Model evaluation index. To select the appropriate model, we used the precision rate (P), recall rate (R), and the average accuracy of the mean (mAP) as the performance evaluation index of the training network model. The specific calculation process was as follows:
 (3) (3)
 (4) (4)
In these equations, TP is the target number with a CIoU value greater than 0.5, FP is the target number with a CIoU value less than 0.5, and FN is the amount of unidentified wheat.
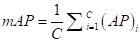
The value for mAP was obtained by averaging the precision average (AP) of all categories. At the same time, AP was acquired by measuring the area of the P-R curve, which consists of the precision rate and the recall rate.
 (5) (5)
 (6) (6)
Here, k is the node of the recall rate, kn represents the cutoff point of the recall rate corresponding to the maximum precision, N denotes the total number of samples in the test set, C is the number of categories, and (AP)i signifies the average precision of the category in i.
Besides, the test requires both accurate classification and high recognition accuracy. The variable F1 can takes into account both the precision rate and the recall rate of the classification model, so the value of F1is used to further illustrate the performance of the network model. The formula for calculating F1is as follows:
 (7) (7)
RESULTS AND DISCUSSION
Analysis of Test Results: In this experiment, we used mAP to evaluate the performance of the improved network model. Figure 8 shows the P-R curves of winter wheat recognition at different leaf stages and indicates that the P-R curve corresponding to the 2-leaf stage was always higher than winter wheat at the 3-leaf stage. Moreover, the precision rates of the two curves at the equilibrium point were 78.28% and 72.42%, respectively. Besides, when the recall rate was 75%, the precision rate was still more than 80%, indicating that the network model maintained a high precision rate in cases of high recall rate. At the same time, by using Equation 5 from Section 2.2.4, the corresponding AP values of the two kinds of leaf stage winter wheat were 96.43% and 93.87%, respectively. Finally, we used Equation 6 to calculate an mAP value of 95.15%. Therefore, the mean average precision of the improved network model for winter wheat seedling in the data set was 95.15%.

Figure 8. P-R curve of winter wheat at different leaf stages.
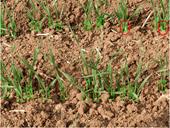
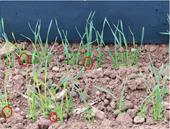
The recognition effect of the improved network model for winter wheat at different seedling stages is shown in Figure 9. The images on the left side are the recognition effect pictures of winter wheat during the 2-leaf stage, while the right side shows images of the 3-leaf stage. Images include those taken on sunny and cloudy days, in sparse and dense conditions, and with or without background plates. By observing the recognition effect diagram, we found that the overall recognition effect of winter wheat at the 2-leaf stage was slightly higher than at the 3-leaf stage, which was consistent with the AP comparison results calculated above. At the same time, judging from weather conditions, the effect of light on the identification of winter wheat in the 2-leaf stage was higher than that in the 3-leaf stage, primarily because the rhizome color of winter wheat at the 2-leaf stage was lighter and more easily affected by light. Different light intensities inevitably had an impact on the recognition effect. Finally, by combining the density and recognition effects of the four images, we discovered that in the sparse environment, the 3-leaf stage winter wheat was more favorable for recognition, compared with the 2-leaf stage winter wheat. However, the recognition effect of the 2-leaf stage winter wheat was superior in a dense environment. According to the analysis, the main reason was that the rhizome characteristics of winter wheat in the 3-leaf stage were more prominent than those in the 2-leaf stage, and were easier to identify. However, in dense conditions, because the small rhizome became thicker at the 3-leaf stage, shadowing between winter wheat rhizomes with small spacings became more serious. Besides, with the increased number of winter wheat leaves and the change in their morphology, the occlusion of rhizome features was aggravated, which also further increased the difficulty of winter wheat recognition. The above analysis, confirms that although there was a small amount of missing recognition in the improved network model, it still achieved a satisfactory recognition effect.
(a) (b)
(c) (d)
Figure 9. Recognition effect diagram of different wheat: (a) 2-leaf stage, cloudy day, no background panel; (b) 3-leaf stage, cloudy day, background panel; (c) 2-leaf stage, sun day, background panel; (d) 3-leaf stage, sun day, no background panel.
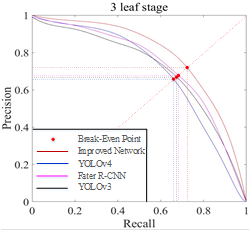
Comparative Experiments of Different Network Models: To further analyze the performance of the model, we compared the improved network model with the target recognition network YOLOv4, YOLOv3, and Faster-RCNN models. At the same time, we still used mAP as the evaluation index of the model. Figures 10 (a) and (b) show the 2-leaf and 3-leaf wheat P-R curves using the four different network models. The diagram indicates that the P-R curve of the improved network model was always higher than each of the comparison networks in the different leaf stages. Even when the recall rate was about 80%, the precision rate of the improved network model remained above 70%, which was much higher than the other three models. In this paper, the reference model with the second-best performance was the basic YOLOv4 model. By carefully observing the P-R curve of the YOLOv4 network model for the recognition of 3-leaf seedling winter wheat, we discovered that when the recall rate was between 48% and 90%, the precision rate decreased significantly, even lower than the Faster-RCNN and YOLOv3 models. However, the improved network in this paper offset the deficiencies of the basic YOLOv4 network to a large extent, and the P-R curve for the 3-leaf stage was always the best. Additionally, by comparing the balance points in the two images, we noticed that the balance point of the improved network was always at the highest point, followed by YOLOv4 and Faster-RCNN, while the balance point of YOLOv3 was always the worst.
(a) (b)
Figure 10. P-R curve of the improved network: (a) P-R curve of the 2-leaf stage; (b) P-R curve of the 3-leaf stage.
To more intuitively display the equilibrium state of the four network models at different leaf stages, Figure 11 shows the specific values of the precision rate or recall rate at the equilibrium point for the two images in Figure 10.
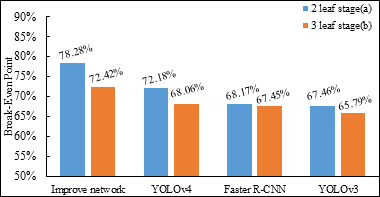
Figure 11. Comparison of precision rate or recall rate at different network equilibrium points.
The AP values of wheat in the 2-leaf and 3-leaf stages for the different network models were calculated using Equation 5. Besides, Equation 6 was used to determine the mAP values of each network model. As Figure 12 illustrates, the AP values of the improved network model were the best, at 96.43% and 93.87%, respectively, for the 2-leaf and 3-leaf stages, while the mAP value reached 95.15%. Furthermore, the mAP values of YOLOv4, Faster-RCNN, and YOLOv3 were 78.87%, 75.39%, and 74.09% respectively. These values were significantly lower than those of the improved network model. By comparing the mAP values, the improved network model achieved better recognition results for the 2-leaf stage and 3-leaf stage winter wheat, especially for the 3-leaf stage winter wheat. Besides, the recognition accuracy of the improved network model was significantly higher than the other three comparison networks.
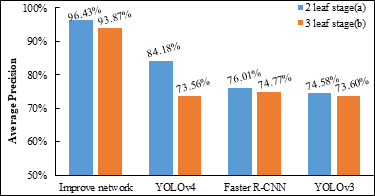
Fig 12: Comparison of AP values of different networks.
To demonstrate the performance of the improved network model more comprehensively, we compared the following different network structures from four aspects: F1 value, training time, average recognition speed, and the number of parameters. Here, the F1 value was calculated using Equation 7. The comparison results, which are presented in Table 1, indicated that the F1 value of the improved network model reached up to 94.6%, which was 4.5% higher than the second-ranked Yolov4 model. Additionally, the number of parameters and the training time of the new model were the lowest among the four models. Compared with the basic network YOLOV4, the recognition speed of the improved network model was about 1.49 times faster.
Table 1: Comparison of recognition performance of the four network models
|
Network
|
F1/%
|
Training
Time/s
|
Mean recognition speed /s
|
Number of model parameters
|
|
Improved network
YOLOv4
YOLOv3
faster-RCNN
|
94.6
90.1
85.7
84.3
|
19800
21525
28116
31372
|
0.07
0.104
0.172
0.211
|
1. 6×10⁷
2.7×10⁷
4.2×10⁷
4.7×10⁷
|
Figure 13 (1) ~ (8) displays the recognition effect of the four network models on winter wheat rhizomes at the 2-leaf stage and 3-leaf stage. Overall, compared with the other networks, the enhanced network model demonstrated a better detection effect for winter wheat rhizome. Figure 13 clearly shows that there were more missed recognition phenomena in the three other comparative network models, during both the 2-leaf stage and the 3-leaf stage.
|
(1)
|
(2)
|
|
(a)Improve Network
|
|

(3)
|
(4)
|
|
(b)YOLOv4
|
|
(5)
|
(6)
|
|
(c)YOLOv3
|
|
(7)
|
(8)
|
|
(d)Faster-RCNN
|
Figure 13. Comparison of results using different network methods: (a) Improve Network; (b) YOLOv4; (c) YOLOv3; (d) Faster-RCNN.
DISCUSSION
Experimental results demonstrate that the improved network model based on YOLOv4 was clearly superior to the other comparative network models. For instance, the adaptive scaling structure in the improved network model obtained optimal image scaling sizes through the search algorithm, further increasing the recognition ability of the winter wheat rhizome at the seedling stage. Chen Jinsheng (2020) developed a "target size adaptive function" for small target detection in dense scenes. When detecting dense vehicles, the mAP value was 85.1%. Additionally, because the improved network model used the idea of depthwise separable convolution for reference, its running speed was significantly faster than the contrasting network. Depthwise separable convolution has become one of the most common methods for reducing the number of parameters and improving running speed in recent years. For instance, Liang Yinhao et al. (2020) combined the SSD network with the MobileNet network and applied them to the UAV airborne system for corn tassel detection. However, the improved network in this paper also had the issue that a tiny minority of winter wheat could not be identified at the seedling stage. As Figure 14 illustrates, two of them were not recognized. From Figure 14(a), we can see that the main reason for the identification failure was that the current winter wheat growth was obviously insufficient, the rhizome diameter size was small, and most of the rhizome structure was obscured by surrounding masses of soil. The winter wheat that could not be identified in Figure 14(b) was closely clustered, the growth of several winter wheat plants was too dense, and the rhizomes were highly overlapped. By synthesizing the information from the two figures, the root cause of missing recognition was the lack of key information, such as outline, color, and texture of winter wheat rhizome. This subsequently led to the difficulty of feature extraction.
(a) (b)
Figure 14. The example of unidentified winter wheat: (a) 2-leaf stage; (b) 3-leaf stage.
Figure 15 shows the recognition effect of the basic YOLOv4 and the improved network on the same winter wheat seeding. Figure 15(a) indicates that several wheat rhizomes were small and not obvious, due to the effect of shelter and light. After model training of the YOLOv4 network, they were not effectively identified. However, in the recognition effect map of Figure 15(b), we can see that all the seedlings of winter wheat were correctly identified with the enhanced model. This indicates that the improved network model has superior wheat rhizome detection effects, as well as a stronger anti-interference ability to external factors such as light and occlusion.
(a) (b)
Fig 15. Recognition results of the same seedling wheat by two kinds of networks: (a) YOLOv4; (b) The improve network.
In the future, we will further optimize the network model without sacrificing recognition accuracy and improve the ability of the model to extract winter wheat rhizome features, especially for smaller and more occluded rhizomes. Besides, we will attempt to expand the data set to train and identify winter wheat in the seedling stage for different regions and varieties. At the same time, we will also apply the improved network model to portable and compact smartphone terminals to ensure that staff can easily identify and count winter wheat at the seedling stage in the field conveniently and in real-time. This will improve the practical application value of the improved model in the field of agriculture.
Conclusions: 1) In this paper, based on the YOLOv4 network model, we firstly replaced the CSPDarkne53 feature extraction network with a simplified MobileNetv3 network, then added an adaptive image scaling layer in front of the replacement network. Next, we used the coyote optimization algorithm to optimize the learning rate and convolution kernel size of the network model. Ultimately, we devised an improved YOLOv4 model to count the number of winter wheat seedlings in the field.
2)In the natural growth environment, results of winter wheat recognition at the seedling stage in the field indicated that the improved network model had better recognition effects for the 2-leaf stage than the 3-leaf stage, with AP values of 96.43% and 93.87%, respectively. Besides, using the same computer configuration, the values for mAP, F1, training time, average recognition speed, and parameter number were superior to the YOLOv4, YOLOv3, and Faster-RCNN network models. The mAP and F1 values of the improved network model were 95.15% and 94.6%, respectively, which were 12.28% and 4.5% higher than YOLOv4, and the average recognition speed was 1.49 times faster. Therefore, the recognition accuracy of the improved network model was considerably better.
Overall, the improved network model in this paper meets the requirements for the accurate and rapid recognition of winter wheat at the seedling stage in the field environment and offers a new method for counting winter wheat at the seedling stage.
Refer Funding: The National Natural Science Foundation of China, No. 61805073
Conflict of interest: The author declares no conflict of interest
REFERENCES
- Li, H., S. Ding, K. Sun, R. He, X. Wang, X. Li and F. Liu (2019). Effect of seedling density on single grain precision sowing of wheat in rice stubble. J. Agric. Sci. 35: 1316-1322.
- Jia, L., J. Zhang, C, Lu, H. Gao, T. Liu, J. Wang and Q. Xue (2019). Planting Density Affects Population Traits and Yield of Wheat in Weibei Arid Region. Chin. Agric. Sci. Bull. 2019, 35 (7): 15-19.
- Wang Z., T Guo, H Wang and Y Wang (2001). Effect of planting density on photosynthetic characteristics and grain yield of super-high-yield winter wheat at late growth stages. Tri. Crops, 21(3): 64-67.
- Olsen, J., L. Kristensen and J. Weiner (2006). Influence of sowing density and spatial pattern of spring wheat (Triticum aestivum) on the suppression of different weed species. Weed. Biol. Manag. 6(3): 165-173.
- Z., W. Wu, S. Zhang, Q. Cui and R. Li (2020). Estimating Wheat Planting Density Based on Multiple Ridge Regression. J. Agric. Sci. Technol. 22(06):72-80.
- Liu X., X. Zhang and C. Chen (2020). Prediction of Wheat Yield Using Color and Texture Feature Data of UAV Image at Early Growth Stage. J. Triticeae. Crops. 40(80): 1002-1007.
- Wang W., S. Liu, S. Song and I. Møller (2015). Proteomics of seed development, desiccation tolerance, germination and vigor. Plant. Physio. Bioch. 86: 1-15.
- Liu Z., Z. He, F. Miao and B. Jia (2019). Method and experiment for estimating emergence rate of water and fertilizer integrated maize based on drone technology. Acta. Agric. Zhejiangensis. 31(06): 977-985.
- Wang, R (2019). Causes of poor emergence of wheat and preventive countermeasures. Henan. Agri. 9 (25): 36.
- Liu, T., C. Sun, L. Wang, X. Zhong, X. Zhu and W. Guo (2014). Field wheat ear count based on image processing technology. Trans. Chin. Soc. Agric. Mac. 45: 282- 290.
- Liu, Z., W. Huang and L. Wang (2019). Automatic counting of wheat ears in field based on improved K-means clustering algorithm. Chin. Soc. Agric. Eng. 35: 174-181.
- Ji, K. (2019). Design and implementation of wheat seedling counting system based on image processing. J. Agric. Univ. Hebei. China.
- Jia, H., G. Wang, M. Guo, S. Dylan, X. Jiang and J. Zhao (2015). Method and experiment of obtaining maize plant number based on machine vision. Chin. Soc. Agric. Eng. 31: 215-220.
- Reza, M., I. Na, Lee and K. Lee (2017). Automatic Counting of Rice Plant Numbers After Transplanting Using Low Altitude UAV Images. J. Con.13: 1-8.
- Li, T., S. Ruan, Z. Chen and Z. Mao (2020). Summary of target detection based on convolution neural network, Eco. Guide. 28: 18-20.
- Huang, J., and G. Zhang (2020). A Survey of Target Detection algorithms based on Deep Convolution Neural Networks, Eng. Applica. 56: 12-23.
- Pazoki, A., F. Farokhi. and Z. Pazoki. (2014). Classification of rice grain varieties using two artificial neural networks (mlp and neuro-fuzzy). Anim. Plant. Sci. 24(1), 336-343.
- Girshick, R., J. Donahue, T. Darrell and J. Malik (2014). Rich feature hierarchies for accurate object detection and semantic segmentation. conference on Computer Vision and Pattern Recognition. Columbus. pp.580-
- Wang, R.., H, Chen and C. Guan (2021). Random convolutional neural network structure: An intelligent health monitoring scheme for diesel engines. 171: 108786.
- Girshick, R.. and Fast R-CNN (2015). In Proceedings of the IEEE International Conference on Computer Vision, Santiago, Chile, 13–16 December 2015. pp. 1440–1448.
- Ye, Y., K. Ma, H. Zhou, D. Arola and D. Zhang (2018). An Automated Shearography System for Cylindrical Surface Inspection, 135: 400-405.
- Ren, S., K. He, R. Girshick and J. Sun (2015). Faster RCNN: Towards real-time object detection with region proposal networks, Neural. Inf. Process. Syst. 39: 91–99.
- Sun, Z., C. Zhang, L. Ge, M. Zhang, W. Li and Y. Tan (2019). Image detection method of field broccoli seedlings based on Faster R-CNN, Chin. Soc. Agric. Mac. 50: 216-221.
- Song, Z., L. Fu, J. Wu, Z. Liu, and R. L, Y. Cui (2019). Kiwifruit detection in field images using Faster R-CNN with vgg16. IFAC-Papers OnLine. 52 (30): 76-81.
- Yan, J., Y. Zhao, L. Zhang, X. Su, Y. Lu, F. Zhang, W. Fan and L. He (2019). Improved Faster-RCNN recognition of Rosa roxburghii Fruit in Natural Environment, Chin. Soc. Agric. Eng. 35:144-151.
- Liu, W., D. Anguelov, D. Erhan, C. Szegedy, C. Fu and A. C. Berg (2016). SSD: Single Shot Multibox Detector. In Proceedings of the European Conference on Computer Vision, Amsterdam, The Netherlands, 8–16 October 2016. pp. 21–37.
- Peng, H., B. Huang, Y. Shao, Z. Li, Z. Zhang, Y. Chen and J. Xiong (2018). A general improved SSD model for target recognition of many kinds of fruit picking in natural environment, Trans, Chin. Soc. Agric. Eng. 34: 155-162.
- Tan, M., R. Pang and Q.V. Le (2020). Efficientdet: Scalable and efficient object detection. In Proceedings of the IEEE/CVF Conference on Computer Vision and Pattern Recognition, Seattle, WA, USA, 14–19 June 2020. pp. 10781–10790.
- Redmon, J., S. Divvala, R. Girshick and A. Farhadi (2016). You Only Look Once: Unifified, Real-Time Object Detection, In Proceedings of the 2016 IEEE Conference on Computer Vision and Pattern Recognition (CVPR), Las Vegas, NV, USA, 26 June–1 July 2016. pp. 779–788.
- Redmon, J., and A. Farhadi (2017). YOLO9000: Better, Faster, Stronger, In Proceedings of the 2017 IEEE Conference on Computer Vision and Pattern Recognition (CVPR), Honolulu, HI, USA, 21–26 July 2017. pp. 6517–6525.
- Redmon, J., and A. Farhadi (2018). YOLO V3: An Incremental Improvement, arXiv. arXiv:1804.02767v1, 1–22.
- Bochkovskiy, A., and C. Wang (2020). YOLOv4: Optimal Speed and Accuracy of Object Detection, arXiv. arXiv:2004.10934v1.
- Liu, X., C. Fan, J. Li, Y. Gao, Y. Zhang and Q Yang (2020). Strawberry recognition method based on convolution neural network, Chin. Soc. Agric. Mac. 51:237-244.
- Liu, T., T. Yang, C. Li, R. Li, W. Wei, X. Zhong, C. Sun and W. Guo (2018). A method to calculate the number of wheat seedlings in the 1st to the 3rd leaf growth stages. Plant Methods.14(3): 179-188.
- Wang, C. Y., H. Y. M. Liao, I. H. Yeh, Y. H. Wu, P. Y. Chen and J. W. Hsieh (2020). CSPNet: A new backbone that can enhance learning capability of CNN, In Proceedings of the 2020 IEEE/CVF Conference on Computer Vision and Pattern Recognition Workshops, Online, 16–18 June 2020. pp. 390–391.
- He, K., X. Zhang, S. Ren and J. Sun (2014). Spatial pyramid pooling in deep convolutional networks for visual recognition, Notes Comput. Sci. (Incl. Subser. Lect. Notes Artif. Intell. Lect. Notes Bioinform.) .8691, 346–361.
- Liu, S., L. Qi, H. Qin, J. Shi and J. Jia (2018). Path Aggregation Network for Instance Segmentation, Proc. IEEE Comput. Soc. Conf. Comput. Vis. Pattern Recognit. 8759–8768.
- Howard, A. G., M. Zhu, B. Chen, D. Kalenichenko, W. Wang, T. Weyand and M. Andreetto (2017). MobileNets: Efficient Convolutional Neural Networks for Mobile Vision Applications. 1704.04861.
- Howard, A. G., M. Sandler, G. Chu, B. Chen, M. Tan, Y. Zhu, R. Pang and V. Vasudevan (2019). Searching for MobileNetV3. 2019 IEEE/CVF International Conference on Computer Vision. Seoul, Korea (South), 27 February 2020. pp. 1314-1324.
- Sandler, M., A. Howard, M. Zhu, A Zhmoginov and L.C. Chen (2018). MobileNetV2: Inverted residuals and linear bottlenecks. In Proceedings of the IEEE Conference on Computer Vision and Pattern Recognition, Salt Lake City, UT, USA, 18–22 June 2018. pp. 4510–4520.
- Lin, T., P. Dollar, R. B. Girshick, K. He, B. Hariharan and S. J. Belongie (2017). Feature Pyramid Networks for Object Detection. In Proceedings of the 2017 IEEE Conference on Computer Vision and Pattern Recognition, CVPR 2017, Honolulu, HI, USA, 21–26 July 2017. pp. 936–944.
- Pierezan, J., and L. S. Coelho (2018). Coyote Optimization Algorithm: A new metaheuristic for global optimization problems. Proceedings of the IEEE Congress on Evolutionary Computation (CEC), Rio de Janeiro, Brazil, July 2018. pp. 2633-2640.
- Chen J (2020). Research and development of adaptive detection algorithm for lightweight target size. M.S, Zhejiang University, Fujian Province, China, 2020.
- Liang, Y., Q. Chen, and C. Dong (2020). Yang, Study on tassel detection of corn based on deep learning and UAV remote sensing technology, J. Agric. Sci. 35: 456-464.
|